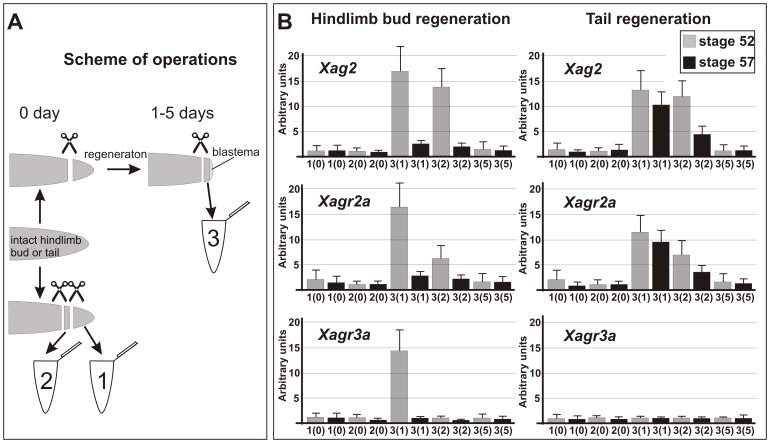
Figure 3. Analysis of Agrs expression by qRT-PCR.
(A). Scheme of experiments. (B). QRT-PCR analysis of Xag2, Xagr2a and Xagr3a expression in tissue samples of 1st -3rd types as indicated in (A). Days after amputation are in brackets. All graphs represent means of triplicate experiments. Bars indicate standard deviations. The geometric mean of expression of ornithine decarboxylase (ODC)16 and elongation factor 1alpa (EF-1alpha)16 was used for normalisation of experimental values. The value of normalised PCR signal in sample 2(0) in each series was taken as an arbitrary unit.

