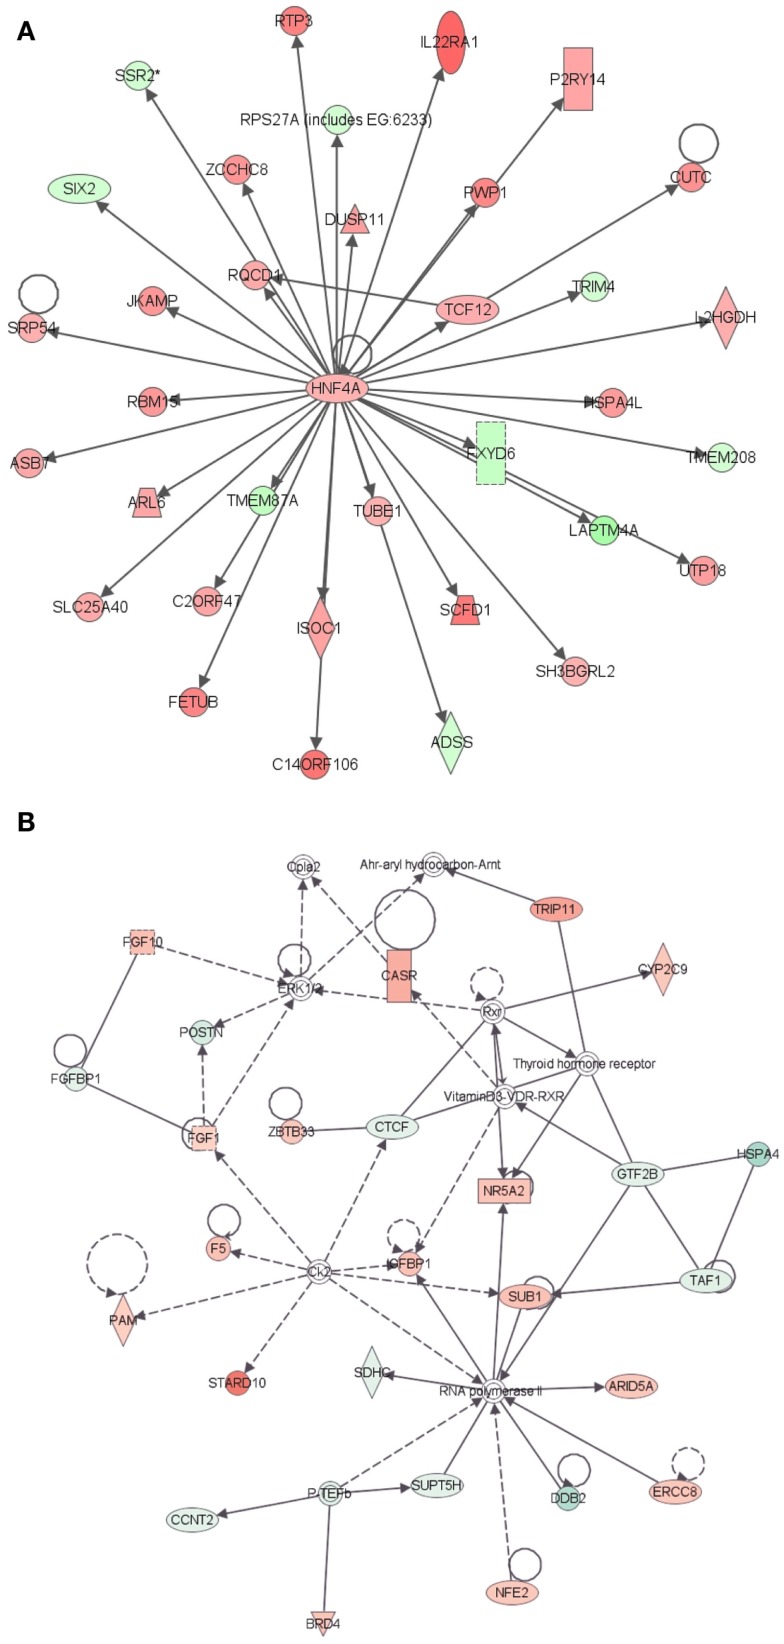
Figure 2.
Ingenuity Pathway Analysis (IPA) of genes differentially expressed in LRECb vs. ECb. Genes that were differentially expressed in LRECb vs. ECb were imported into IPA software, which revealed the involvement of several networks pertinent to LRECb. Network (A) pertains to cellular growth and proliferation and shows a single module with HNF4A at its hub. Network (B) relates to cell cycle and post translational modification. Red color denotes up-regulation in LRECb and green color denotes down-regulation in LRECb relative to control cells. The IPA legend is shown in Figure A1 in Appendix.

