
Figure 1.
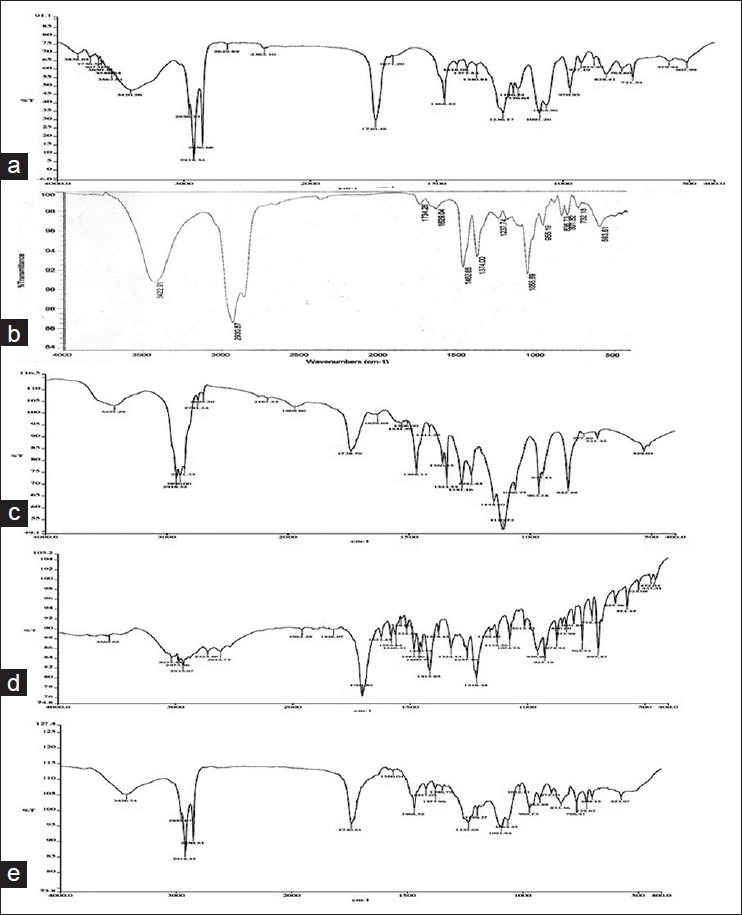
(a) Fourier transform infrared (FTIR) spectrum of distearoyl phosphatidyl choline, (b) FTIR spectrum of cholesterol, (c) FTIR spectrum of PE 18:0/18:0-PEG, (d) FTIR spectrum of flurbiprofen, (e) FTIR spectrum of physical mixture of flurbiprofen and excipients