. 2012 Jul-Dec;2(2):161–168. doi: 10.4103/2141-9248.105665
Copyright: © Annals of Medical and Health Sciences Research
This is an open-access article distributed under the terms of the Creative Commons Attribution-Noncommercial-Share Alike 3.0 Unported, which permits unrestricted use, distribution, and reproduction in any medium, provided the original work is properly cited.
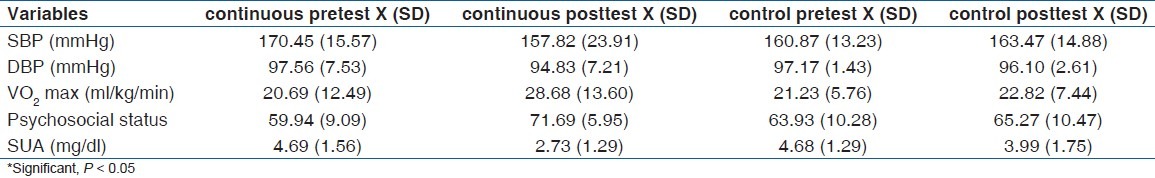
Table 2.
Groups mean (SD) pretest and posttest values (n = 217)