FIGURE 2.
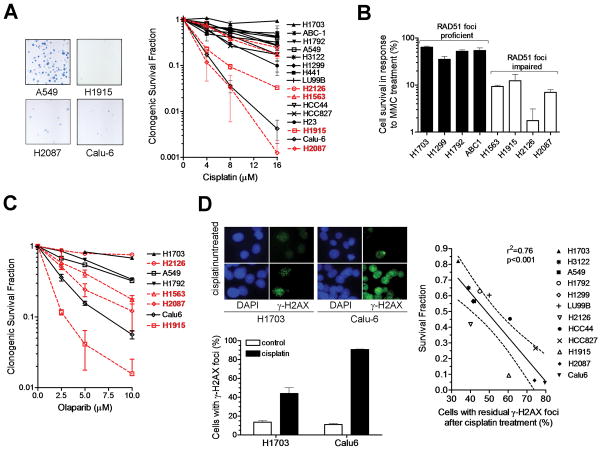
Sensitivity of NSCLC cell lines to DNA damaging anti-cancer drugs. A, Left panel shows representative examples of colony forming ability after treating A549 cells (200 cells seeded) or cisplatin-sensitive cell lines (2,000-5,000) with 16 μM cisplatin. Right panel, clonogenic survival fraction is plotted against cisplatin concentration. Data points represent mean with standard error based on at least 2 independent repeat experiments. Cell lines with putative RAD51 foci formation defects are highlighted in red. B, Clonogenic survival fraction after treatment with 0.25 mg/ml mitomycin C (MMC) for 1 hour is plotted for a subset of cell lines. C, Clonogenic survival fraction after treatment with 10 μM of olaparib for 72 hours. Cell lines with putative RAD51 foci formation defects are highlighted in red. Bars represent mean with standard error based on at least 2 independent repeat experiments. D, Left panels illustrate the difference in the formation of γ-H2AX foci at 24 hours following treatment of cisplatin-resistant H1703 and cisplatin-sensitive Calu-6 cells with 8 μM cisplatin. Right panel shows the correlation between clonogenic cell survival versus residual γ-H2AX foci present at 24 hours after cisplatin treatment with 8 μM. Dotted line reflects 95% confidence limits of the linear regression line.

