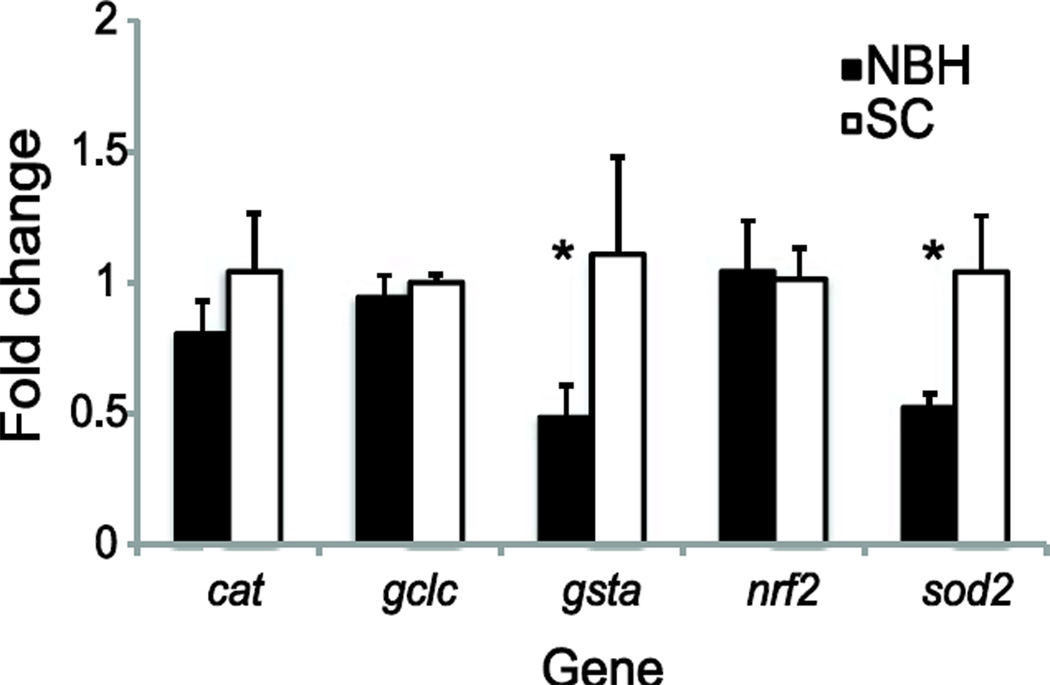
Figure 7. Basal expression of nrf2 and genes known to be regulated by nrf2.
Data presented are the mean ± SEM (β-actin-corrected) where N = 3 pools of five unexposed control embryos at 7 dpf. Values are normalized to SC embryos. Data were analyzed using a two-factor ANOVA followed by Fisher’s PLSD; * indicates a significant difference in basal gene expression between New Bedford Harbor (NBH) and Scorton Creek (SC) embryos, p < 0.05.

