
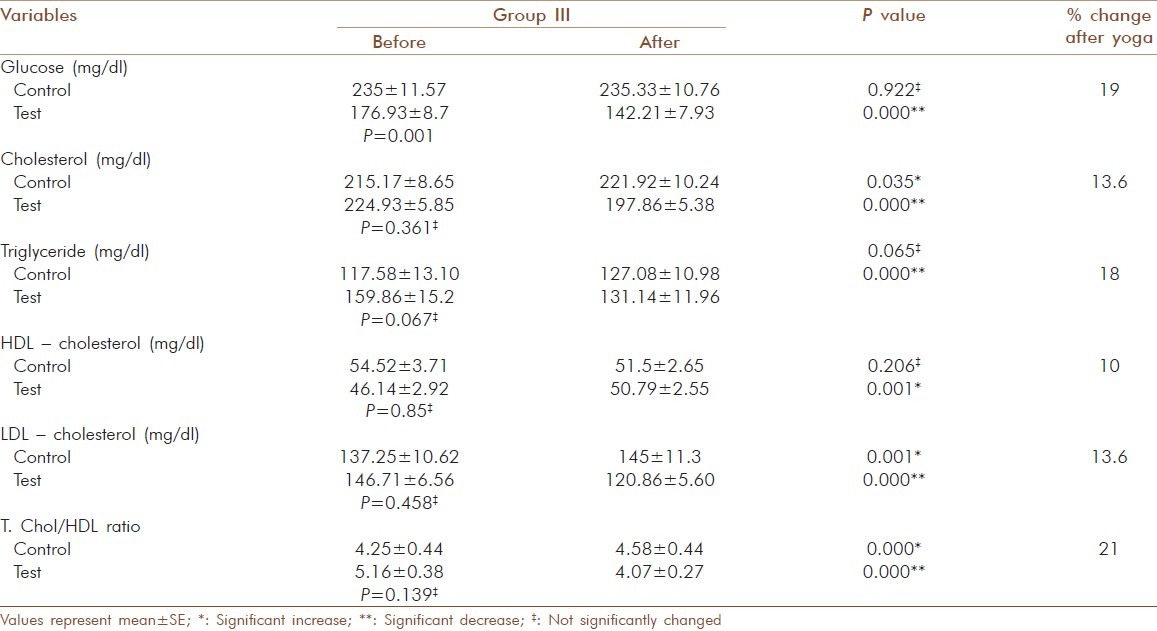
Table 5.
Glucose and lipid profile values before and after yogic practice of test group III and comparison with control group III
Official websites use .gov
A
.gov website belongs to an official
government organization in the United States.
Secure .gov websites use HTTPS
A lock (
) or https:// means you've safely
connected to the .gov website. Share sensitive
information only on official, secure websites.
Glucose and lipid profile values before and after yogic practice of test group III and comparison with control group III