
Figure 6.
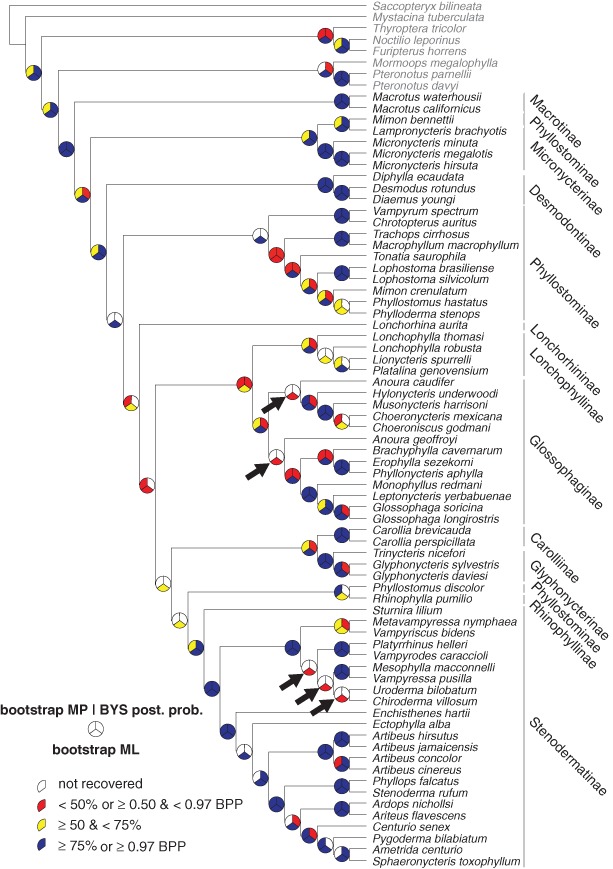
Maximum likelihood (ML) tree resulting from analysis of 5434 molecular characters [excluding mitochondrial cytochrome oxidase 1 (COX1) third positions], with weights of 0.25 for loops and mitochondrial cytochrome b (CYTB) third positions, and summary of maximum likelihood (ML) and maximum parsimony (MP) bootstraps and Bayesian (BYS) posterior probabilities (BPP). The phylogeny shown was obtained using a single model of sequence evolution across all partitions (model 1P; log-likelihood = −242716). Black arrows indicate differences between the 1P ML phylogeny (shown) and the 8b multiple-model ML phylogeny (Table 1; log-likelihood = −235619; the multiple-model phylogeny makes Anoura monophyletic, and provides an alternative resolution for the non-glossophagine nodes highlighted). Classification follows Baker et al. (2003), outgroups are shown in grey type.