Abstract
This paper reports on an ATR-FTIR spectroscopic investigation of the CO2 absorption characteristics of a series of heterocyclic diamines: hexahydropyrimidine (HHPY), 2-methyl and 2,2-dimethylhexahydropyrimidine (MHHPY and DMHHPY), hexahydropyridazine (HHPZ), piperazine (PZ) and 2,5- and 2,6-dimethylpiperazine (2,6-DMPZ and 2,5-DMPZ). By using in situ ATR-FTIR the structure–activity relationship of the reaction between heterocyclic diamines and CO2 is probed. PZ forms a hydrolysis-resistant carbamate derivative, while HHPY forms a more labile carbamate species with increased susceptibility to hydrolysis, particularly at higher CO2 loadings (>0.5 mol CO2/mol amine). HHPY exhibits similar reactivity toward CO2 to PZ, but with improved aqueous solubility. The α-methyl-substituted MHHPY favours HCO3− formation, but MHHPY exhibits comparable CO2 absorption capacity to conventional amines MEA and DEA. MHHPY show improved reactivity compared to the conventional α-methyl- substituted primary amine 2-amino-2-methyl-1-propanol. DMHHPY is representative of blended amine systems, and its reactivity highlights the advantages of such systems. HHPZ is relatively unreactive towards CO2. The CO2 absorption capacity CA (mol CO2/mol amine) and initial rates of absorption RIA (mol CO2/mol amine min−1) for each reactive diamine are determined: PZ: CA=0.92, RIA=0.045; 2,6-DMPZ: CA=0.86, RIA=0.025; 2,5-DMPZ: CA=0.88, RIA=0.018; HHPY: CA=0.85, RIA=0.032; MHHPY: CA=0.86, RIA=0.018; DMHHPY: CA=1.1, RIA=0.032; and HHPZ: no reaction. Calculations at the B3LYP/6-31+G** and MP2/6-31+G** calculations show that the substitution patterns of the heterocyclic diamines affect carbamate stability, which influences hydrolysis rates.
Keywords: absorption, amines, carbon dioxide fixation, IR spectroscopy, nitrogen heterocycles
1. Introduction
The dominant sources of anthropogenic CO2 emission are fossil-fuel combustion and industrial processes.[1, 2] Sequestration of this CO2 is now a major target for reduction of atmospheric CO2 levels. While it is clear that any significant long-term reduction in greenhouse gas emissions must involve changing our approach to energy production and consumption, technologies are required to reduce levels in the short term. Coal-fired power stations are the largest point-source emitters of CO2 in Australia and worldwide.[3] The prospect of integrating post-combustion CO2 capture (PCC) technology in both existing and new coal-fired power stations offers the potential to lower CO2 emissions in the face of existing and predicted growth in the number of coal-fired power stations.[4]
Currently, aqueous amine-based PCC is viewed as the most promising and near-ready technology for the reduction of CO2 emissions from coal-fired power stations. PCC involves separating CO2 from a flue gas stream by chemical absorption and re-releasing CO2 from the absorbent by heating in a two-step process for subsequent storage or industrial use. PCC is industrially proven with absorbents such as aqueous monoethanolamine (MEA), used for decades for CO2 removal from gas streams in small-scale commercial processes such as ammonia production and natural-gas processing.[5, 6]
Despite being an established technology, deployment of current industry-standard technology (30 wt % aqueous MEA) on a large scale applies a considerable efficiency penalty to the power generation process. Regeneration of PCC absorbent is energy-intensive[7] and will result in up to 25 % reduction in the net efficiency of a coal-fired power plant.[8, 9] Clearly, the absorption/regeneration characteristics of the amine-based PCC absorbent will influence the economic feasibility of this technology. One approach to reducing the energy requirements and cost of the PCC process is the development of more cost effective and better performing amines. There is considerable scope to develop absorbents that show higher CO2 absorption, lower regeneration costs and greater chemical stability, particularly in the face of an increasing move towards demonstration-scale PCC plants.
The CO2 absorption/desorption by aqueous amine-based absorbents has been, and continues to be, extensively studied in the search for improvements in PCC efficiency. The CO2 absorption/desorption process is shown schematically in Figure 1. Typically, CO2 reacts with aqueous amines to generate carbamate (1), bicarbonate (2) and a protonated amine. The amine substitution pattern affects the products produced. Primary amines such as MEA and secondary amines like diethanolamine (DEA) and piperazine (PZ) react with CO2 under aqueous conditions to form a carbamate derivative R1R2NCOO− (Figure 1). The 2:1 reaction stoichiometry restricts CO2 absorption capacity of primary and secondary amines to a theoretical upper limit of 0.5 mol CO2/mol amine. However, it has been demonstrated that the carbamate can be hydrolysed at high CO2 loadings (>0.5 mol CO2/mol amine) to produce bicarbonate and regenerate a free amine,10 which allows for slightly improved absorption capacities (Figure 1). Given the chemical stability of carbamates formed from 1° and 2° amines, hydrolysis does not occur at an industrially relevant rate,11 with the exception of heterocyclic secondary amines such as piperidine, which have been demonstrated to form a labile carbamate that is readily hydrolysed.[10]
Figure 1.
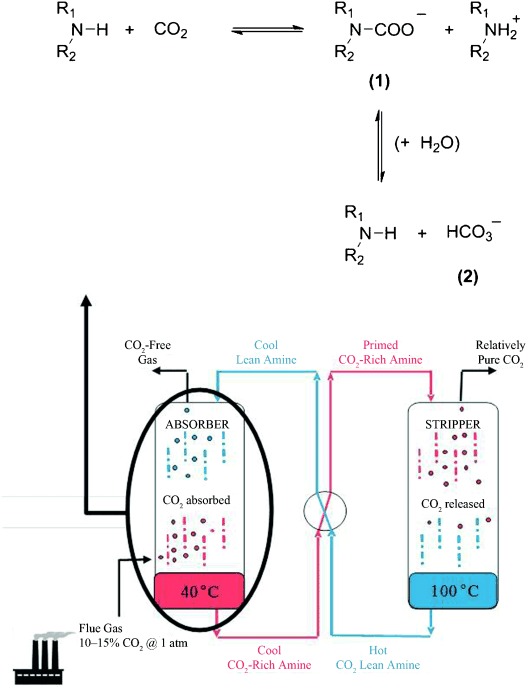
Reaction mechanism leading to carbamate (1) formation for the reaction of CO2 with primary (R1R2NH, where R1 or R2=H) and secondary (R1R2NH) amines (top),[10] which occurs in the absorption step of the PCC process (bottom).
Tertiary amines (R1R2R3N) cannot react directly with CO2 to form carbamates.[12–14] Tertiary amines are believed to act as catalysts facilitating the hydrolysis reaction between CO2 and OH− to form bicarbonate.[12, 14, 15] This 3°-amine pathway is kinetically and thermodynamically less favourable than carbamate formation.[16] Bicarbonate formation is advantageous in consuming only one molecule of amine per molecule of CO2, allowing for increased CO2 absorption capacities.
CO2 absorption by aqueous amines is a reversible process, and the degree of reversibility is amine-dependent. Amines that form stable carbamates exhibit faster reaction rates, but a larger input of energy is required for absorbent regeneration. Conversely, amines that form more bicarbonate than carbamate exhibit slower reaction rates and require less energy for regeneration. Recent technological advances have allowed for the convenient and rapid analysis of these chemical species to be carried out in situ during the PCC absorption/desorption cycle by attenuated total reflectance Fourier transform infrared (ATR-FTIR) spectroscopy. In particular, the ability of ATR-FTIR to distinguish carbamate from bicarbonate formation accelerates the screening of potential PCC amines.[10, 17]
We recently reported the application of ATR-FTIR in a model PCC absorbent system with substituted piperidines.[10] Herein we report on the in situ CO2 absorption characteristics of a series of heterocyclic diamines (Figure 2): piperazine (PZ), 2,6-dimethyl- and 2,5-dimethylpiperazine (2,6-DMPZ and 2,5-DMPZ), hexahydropyrimidine (HHPY), 2-methylhexahydropyrimidine (MHHPY), 2,2-dimethylhexahydropyrimidine (DMHHPY) and hexahydropyridazine (HHPZ).
Figure 2.
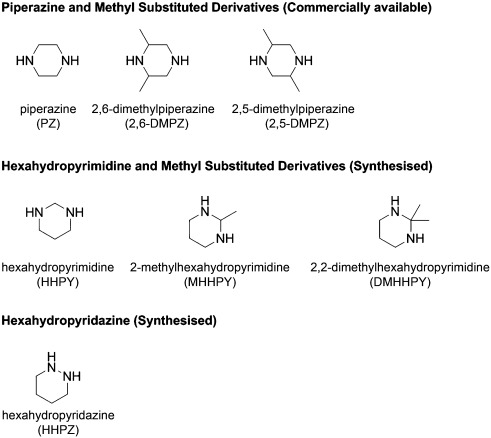
Chemical structures of the heterocyclic amines examined for CO2 absorption properties.
2. Results and Discussion
2.1. Infrared Spectral Analysis
The effect of structural variations on the CO2 absorption characteristics of the heterocyclic diamines shown in Figure 2 were assessed in relation to the IR-identifiable products, that is, carbamate versus bicarbonate absorbance; CO2 absorption capacity, defined as moles of CO2 absorbed per mole of amine in solution (mol CO2/mol amine); and the initial rate of CO2 absorption (mol CO2/mol amine min−1). Full details of our experimental approach is given in the Experimental Section and also in our previous work.[10] Each experiment was conducted until equilibrium was established and a maximum CO2 loading achieved. This was amine-dependent but typically required 45–90 mins. Calculations were also performed to investigate the electronic/steric effects of the structural variations on the amine-carbamate derivatives.
2.1.1. Piperazine (PZ)
Our investigations commenced with parent heterocyclic diamine PZ (Figure 2). As can be seen from the partial (1750–950 cm−1) FTIR spectrum collected during a typical CO2 absorption experiment with an aqueous PZ solution (1.5 mol L−1), five major FTIR peaks evolve during CO2 absorption (Figure 3). The carbamate (NCOO−) derivatives of heterocyclic monoamines have been identified as giving rise to several strong absorbance bands in the 1600–1260 cm−1 region, including the asymmetric  , 1600–1500 cm−1) and symmetric
  , 1450–1350 cm−1) vibrations of the COO− moiety and the N–COO− stretching vibration
  , 1300–1260 cm−1) of the NCOO− derivative.[10] The protonated amine (NH2+) generated on absorption of CO2 was found to give rise to an absorbance band in the 1479–1474 cm−1 region (NH2+ bending mode). In an amine/CO2/H2O system, the bicarbonate (HCO3−) species was identified as giving rise to a broad peak in the 1360–1354 cm−1 region (νsC–O).[10,
17] Assignment was based on the spectral data acquired for 1-methylpiperidine (tertiary amine)/CO2/H2O and 2-amino-2-methyl-1-propanol (AMP)/CO2/H2O systems. It is known that the absorption of CO2 by aqueous AMP (α-dimethyl-substituted MEA derivative) leads to the formation of mostly HCO3− with no significant NCOO− formation.[14,
18,
19] Herein these peaks can be related to the vibrational modes of the potential ionic reaction products, including PZ-carbamate (PZ-COO−), protonated PZ (PZ-H+) and bicarbonate (HCO3−). PZ, being a secondary diamine, should react with CO2 in solution to form NCOO−, predominately in the form of a protonated PZ-COO− derivative (+H2NR1R2NCOO−).[20,
21] One amine moiety acts as the absorption site for CO2, and the other as a proton acceptor. PZ has also been reported to form the dicarbamate (−OOC-PZ-COO−), which was detected by 1H and 13C NMR spectroscopy, at CO2 loadings of 0.2–0.8 mol CO2/mol amine.[20,
21]
Figure 3.
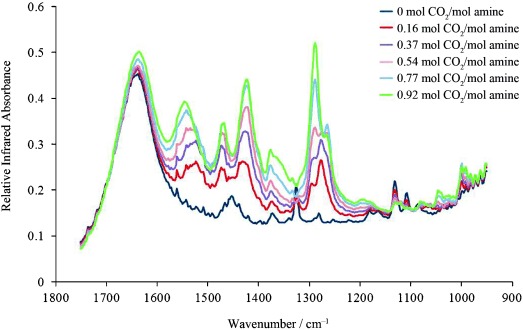
Partial IR spectral profile of an aqueous solution of PZ (1.5 mol L−1) as CO2 is absorbed to a maximum loading of 0.92 mol CO2/mol amine.
The FTIR spectra for the PZ/CO2/H2O system closely resembles that we previously reported for the piperidine/CO2/H2O system, differing only in slight shifts in key IR stretching frequencies.10 At low levels of absorbed CO2 the PZ/CO2/H2O system exhibits the  (1524 cm−1),
  (1432 cm−1) and
  (1276 cm−1 and 1294 cm−1) of the PZ-COO− derivative and the NH2+ vibration of PZ-H+ (1470 cm−1). These peaks shift to 1546, 1425 and 1289 cm−1, respectively, with increasing CO2 absorption levels (Figure 3). As anticipated, a near-linear relationship between cumulative CO2 absorption and IR peak intensity is observed for the spectral peaks assigned to
  ,
,  and PZ-H+. Increased peak absorbance is concomitant with the rate of NCOO− formation at the reaction onset plateauing as a maximum CO2 loading of 0.92 mol CO2/mol amine is approached (Figure 4). This near-linear relationship differs from that observed for the
  bands at 1276 and 1294 cm−1. From the data presented in Figures 3 and 4 the primary
  absorbance emerged at 1276 cm−1 and was the dominant peak, but only at CO2/mol amine loadings of 0.4–0.5 mol CO2/mol amine. At amine loadings greater than 0.5 CO2/mol amine the
  absorbance decreases correspondingly with a sharp increase in intensity of the absorbance band at 1294 cm−1 and a frequency shift to 1289 cm−1. This trend in
  peak absorbance in the 1294–1276 cm−1 region is attributed to formation of −OOC-PZ-COO−. The IR absorbance of PZ/CO2/H2O in this region differs from those of all other heterocyclic amine and diamine systems thus far reported, and the remaining subset of secondary heterocyclic diamines analysed in this study (see below) displays only a single
  absorbance band in the 1283–1272 cm−1 region.
Figure 4.
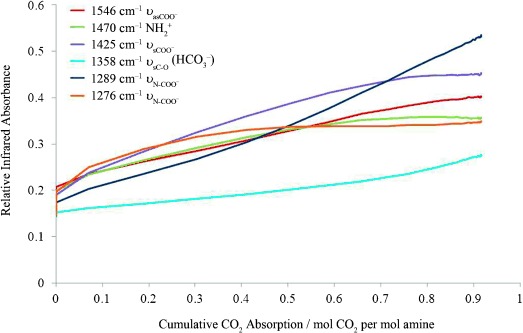
Relationship between cumulative CO2 absorption of an aqueous solution of PZ (1.5 mol L−1) and IR absorbance for the bands assigned to the vibrational modes of NCOO− and HCO3−.
As the IR stretching frequencies of PZ-dicarbamate had not been previously reported we turned to computational approaches to facilitate the assignment of key vibrational modes of PZ-COO−, in particular  . Calculations were performed at the B3LYP/6-31+G** and MP2/6-31+G** levels (gas phase, Spartan ‘08).[22]
The B3LYP/6-31+G** calculations assigned PZ- to a single band at 1282 cm−1 (no scaling), while MP2/6-31+G** positioned this band at 1284 cm−1 (no scaling), similar in shape, but not as broad, as that which initially emerges at 1276 cm−1 in Figure 3. For the −OOC-PZ-COO− species B3LYP/6-31+G** gave two sharp
  absorbances at 1297–1266 and 1348–1345 cm−1, which correlated well with MP2/6-31+G** calculated positions of 1302–1274 cm−1 and 1364–1355 cm−1. These values correlate well with the experimentally observed peaks at values of 1266, 1276 and 1294 cm−1, with the latter two shifting to 1289 cm−1 with CO2 absorption. The B3LYP/6-31+G** and MP2/6-31+G** calculations confirm our peak assignments for the PZ-CO2 carbamate absorption species above.
The evolution of a weak broad absorbance band in the 1360–1350 cm−1 region of the PZ/CO2/H2O IR spectral profile (Figure 3) was assigned to νsC–O of HCO3−. This absorbance band was far less prominent than that we observed for the piperidine/CO2/H2O system. Additionally, this absorbance in the PZ system does not follow the trend observed with the corresponding piperidine system; that is, the depletion of  ,
,  and
and  absorbance bands with concomitant increase in the HCO3− absorbance band for CO2 loadings greater than 0.5 mol CO2/mol amine.[10] The increase in HCO3− absorbance in the piperidine system is attributable to hydrolysis of the initially formed carbamate, which strongly suggests, consistent with the IR data presented herein, that the PZ system forms a hydrolysis-resistant carbamate.
2.1.2. 2,6- and 2,5- Dimethyl-Substituted Piperazine Derivatives (2,6-DMPZ and 2,5-DMPZ)
The effect of alkyl substituents on the CO2 absorption characteristics of PZ was examined with 2,6-dimethylpiperazine (2,6-DMPZ) and 2,5-dimethylpiperazine (2,5-DMPZ) (Figure 2). The IR spectral profiles obtained for 2,6-DMPZ/CO2/H2O and 2,5-DMPZ/CO2/H2O are shown in Figures 5 and 6, respectively.
Figure 5.
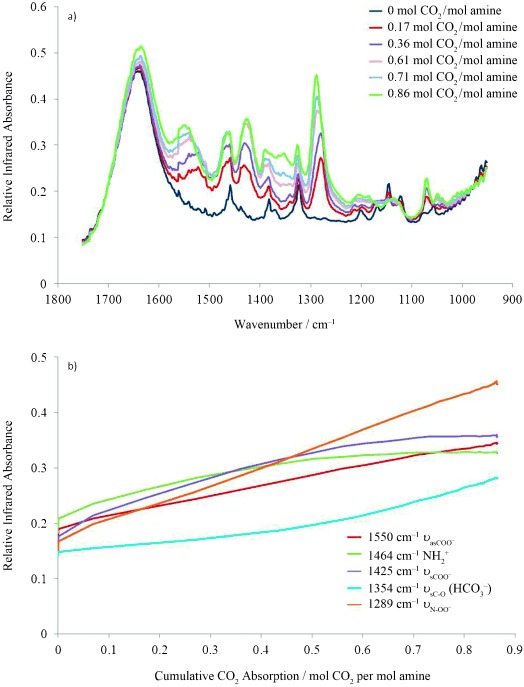
a) Partial IR spectral profile collected for an aqueous solution of 2,6-DMPZ (1.5 mol L−1) as CO2 is absorbed to a maximum loading of 0.86 mol CO2/mol amine. b) Relationship between the cumulative CO2 absorption and IR absorbance for 2,6-DMPZ.
Figure 6.
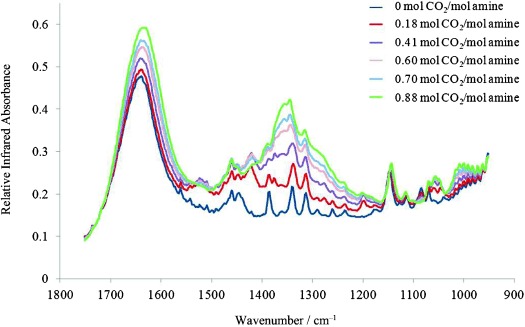
Partial IR spectral profile of an aqueous solution of 2,5-DMPZ (1.5 mol L−1) as CO2 is absorbed to a maximum loading of 0.88 moles CO2 per mole of amine.
The IR spectral data collected for the 2,6-DMPZ/CO2/H2O system (Figure 5 a and b) are almost identical to those recorded for the equivalent PZ system. While the  and
and  bands were less intense and only a single
  absorbance band evolves in the 1289–1276 cm−1 region, all major absorbances of the 2,6-DMPZ system are within 6 cm−1 of those of the PZ system:
  at 1526 cm−1;
  at 1425 cm−1;
  at 1279 cm−1 for 2,6-DMPZ-COO−; NH2+ bending of 2,6-DMPZ-H+ at 1464 cm−1; and HCO3− absorbance at 1354 cm−1. The
  and
and  absorbances shift to 1550 and 1289 cm−1, respectively, with increasing CO2 absorption. The lack of a second
  absorbance is reflected in the relationship between absorbance and cumulative CO2 absorption (Figure 5).
Due to steric congestion arising from the two α-CH3 moieties, initial CO2 absorption most likely occurred at the less hindered and more nucleophilic amine moiety, resulting in NCOO− formation. This reduced nucleophilicity and hence reactivity towards CO2 hindered dicarbamate formation, correlating with the observation of a single  peak in the IR spectrum. The reduced prevalence of dicarbamate formation resulted in increased hydrolysis and HCO3−, as evidenced by rapid growth of the νsC–O band at 1354 cm−1 (Figure 5 a, b). The α-dimethylamine moiety acted catalytically, in a manner analogous to that reported for sterically hindered amines, to accelerate formation of HCO3−.[10]
The subtle structural variations between 2,6-DMPZ and 2,5-DMPZ resulted in a significant change in the IR profile. In the case of the 2,5-DMPZ/CO2/H2O system the most dominant feature is HCO3− absorbance, as evidenced by the intense peak in the 1400–1300 cm−1 region. There is little evidence to support formation of a stable carbamate (Figure 6).[10, 17]
2.1.3. Hexahydropyrimidine (HHPY)
The HHPY/CO2/H2O system displayed some similarity with the PZ/CO2/H2O system in terms of signal positioning but with evidently weaker signals, due in part to the lower concentration of amine (HHPY) available for this study. Notwithstanding this, Figure 7 shows evolution of  at 1570–1520 cm−1,
  at 1427 cm−1 and
  at 1293 cm−1 of HHPY-COO−; the NH2+ bending mode of HHPY-H+ at 1479 cm−1; and HCO3− absorbance at 1354 cm−1. The HCO3− absorbance band was more prominent than that observed for the PZ/CO2/H2O system, that is, HHPY forms a more labile NCOO− derivative that is more susceptible to hydrolysis.
Figure 7.
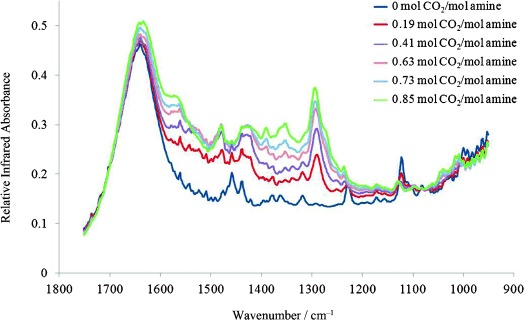
Partial IR spectral profile collected for an aqueous solution of HHPY (1.5 mol L−1) as CO2 is absorbed to a maximum loading of 0.85 mol CO2/mol amine.
2.1.4. 2-Methylhexahydropyrimidine (MHHPY)
The IR spectrum of the MHHPY/CO2/H2O system is dominated by the broad HCO3− absorbance band in the 1400–1300 cm−1 region (Figure 8), which is characteristic of α-substituted amines such as AMP.[10, 17] MHHPY is the methyl-substituted analogue of HHPY. Given the intensity of the HCO3− band in Figure 8, MHHPY was readily hydrolysed under the study conditions, with HCO3− formation dominating on absorption of CO2.
Figure 8.
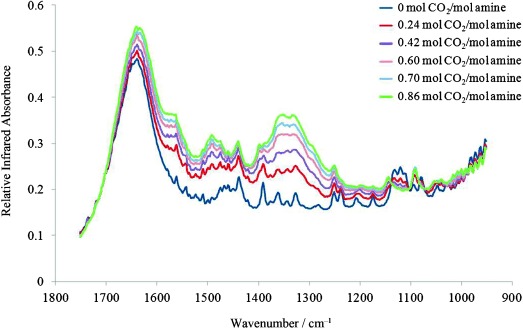
Partial IR spectral profile collected for an aqueous solution of MHHPY (1.5 mol L−1) as CO2 is absorbed to a maximum loading of 0.86 mol CO2/mol amine.
2.1.5. 2,2-Dimethylhexahydropyrimidine (DMHHPY)
Given the structural similarity between DMHHPY and MHHPY, we anticipated predominant HCO3− formation on CO2 absorption by DMHHPY. However the IR profile obtained for the DMHHPY/CO2/H2O system (Figure 9 a) was significantly different to that obtained with MHHPY (Figure 8) and the HHPY and PZ systems (Figures 7 and 3, respectively). Here DMHHPY is acting more in keeping with a blended-amine PPC absorbent system. Close examination of the in-house synthesized DMHHPY revealed the presence of unconverted 1,3-diaminopropane (DAP) which had been unavoidably carried forward to the final product. Hence, the contamination of DMHHPY with DAP explains the observed blended-system-like IR profile (Figure 9 a).
Figure 9.
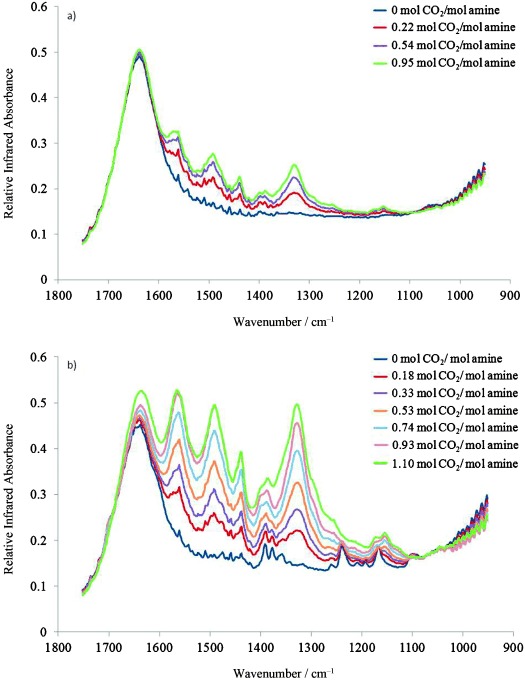
Partial IR spectral profile of an aqueous solution of a) synthesised DMHHPY (1.5 mol L−1) and b) DAP (0.6 mol L−1) as CO2 is absorbed to a maximum loading of 1.10 and 0.95 mol CO2/mol amine, respectively.
Re-examination of the IR spectrum of the DMHHPY/CO2/H2O system identified the NH bending mode of 1,3-diaminopopane at 1602 cm−1. While 1,3-diaminopropane [approximately 37 %, 1.91 g (1H NMR)] was the minor component within the DMHHPY (63 %, 3.24 g)/CO2/H2O system, it formed predominately the corresponding carbamate (DAP) on CO2 absorption.
To allow potential deconvolution of the DAP and DMHHPY signals in the original DMHHPY/CO2/H2O IR profile, data were collected separately for a DAP/CO2/H2O system at a DAP concentration of 0.6 mol L−1 (Figure 9 b). It is apparent that the original DMHHPY system is dominated by the reactivity of DAP (cf. Figure 9 a, b). Both systems show evolution of  (1565 and 1568 cm−1, respectively),
  (1440 cm−1) and
  (1328 and 1330 cm−1, respectively) of the DAP-COO− derivative and the NH3+ bending mode of protonated DAP (1492 cm−1). For the blended DMHHPY/CO2/H2O system, weaker absorbance bands were also observed to emerge at 1385 and 1370–1350 cm−1 at CO2 loadings above 1.0 mol CO2/mol amine. These new peaks are consistent with NCOO− hydrolysis and HCO3− formation. Carbamate hydrolysis was not observed for the pure DAP/CO2/H2O system.
In the initial DMHHPY/CO2/H2O system (Figure 9 a) the DAP-COO− absorbance bands dominate the IR spectrum. However in the DAP/CO2/H2O systems the carbamate absorbances are considerably weaker, the initial effect of which was thought to be that the DAP concentration on the DMHHPY system appears to be significantly higher than the 0.6 mol L−1 evident in Figure 9 b. However, a similar difference in intensity between the carbamate absorbance bands of a blended AMP (2.4 mol L−1)/PZ (0.6 mol L−1) system (Figure 10, further described below) versus an unblended PZ (0.6 mol L−1) system was also observed (Figure 11). Carbamate absorbance in the unblended PZ system was found to be considerably weaker than that observed for the AMP/PZ blended system, despite equivalent PZ concentrations (6 mol L−1). Based on the percentage concentrations determined by 1H NMR spectroscopy the ratio of DMHHPY to DAP in the blended system was 0.95/0.85 mol L−1 (total concentration 1.8 mol L−1).
Figure 10.
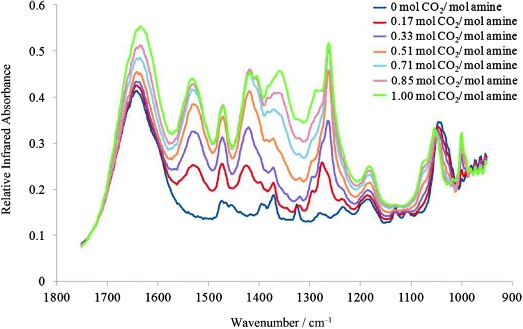
Partial IR spectral profile of an aqueous solution of an AMP/PZ blend (2.4/0.6 mol L−1, respectively) as CO2 is absorbed to a maximum loading of 1.00 mol CO2/mol amine.
Figure 11.
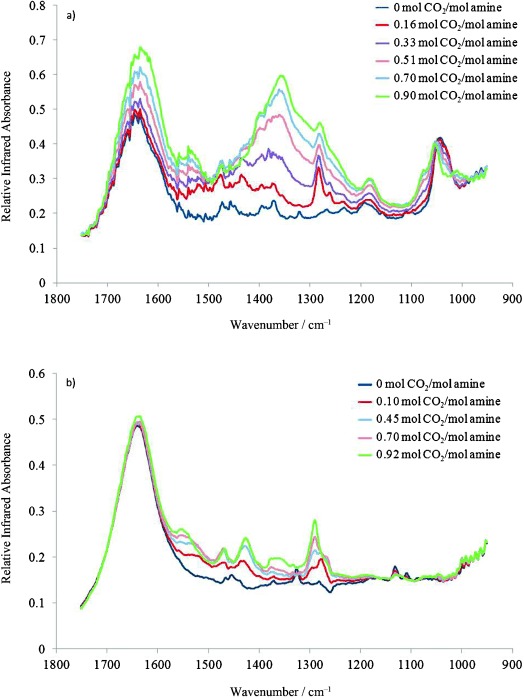
Partial IR spectral profile of an aqueous solution of a) unblended AMP (3 mol L−1) and b) unblended PZ (0.6 mol L−1) as CO2 is absorbed to a maximum loading of 0.84 and 0.92 mol CO2/mol amine, respectively.
For comparative purposes an AMP/PZ blended amine system (2.4 mol L−1/0.6 mol L−1, respectively) was also investigated. Similarly to the blended DMHHPY absorbent, the AMP/PZ blend consists of an amine that forms predominately HCO3− on absorption of CO2 (AMP, major constituent) and an amine that forms predominately NCOO− (PZ, minor constituent). A similar trend in IR absorbance was observed in the spectral data collected for the AMP/PZ/CO2/H2O system (Figure 10) to that described above for the blended DMHHPY/CO2/H2O system. Despite PZ being the minor constituent of the amine blend, the PZ-carbamate absorbance bands dominated the IR spectral profile. Figure 10 shows the evolution of νascoo- (1533 cm−1), νscoo- (1421 cm−1) and  (1276 cm−1 and shifts to 1263 cm−1) of the PZ-COO− derivative and the NH2+ vibration of PZ-H+ (1471 cm−1). HCO3− absorbance was seen to emerge in the 1386–1330 cm−1 region after a CO2 loading of about 0.5 mol CO2/mol amine. For comparison Figure 11 a and b present the IR spectral profile for an unblended AMP/CO2/H2O system (3 mol L−1) and PZ/CO2/H2O system (0.6 mol L−1), respectively. The HCO3− absorbance band was more prominent in the IR spectra of the AMP/PZ/CO2/H2O system compared to that of the DMHHPY/CO2/H2O system. This was most likely due to the difference in amine concentrations, with the AMP/PZ blend having a total concentration of 3 mol L−1 and the DMHHPY/1,3-diaminopropane blend a total concentration of 1.5–1.8 mol L−1.
2.1.6. Hexahydropyridazine
HHPZ absorbed no CO2 during a typical CO2 absorption/FTIR experiment. HHPZ is a hydrazine derivative that is reported to have a pKa value of 7.9,[23] which is much lower than that of PZ (9.73),[24] HHPY (9.75)[25] or 2,5-DMPZ (9.66).[26] The low basicity of HHPZ compared to the other diamines (pKa>9.5) would significantly reduce the reactivity of the amine towards CO2.
2.2. Absorption Capacity and Absorption Rate
Having established the ability of our diamines to absorb CO2, the initial absorption rate RIA and absorption capacity CA were determined. The RIA value was measured by a thermal gravimetric analysis (TGA) method, and CA was measured simultaneously with the IR spectral data (see Experimental Section). These data are presented in Table 1. For comparison, the reactivity of conventional absorbents MEA, DEA and AMP (α-dimethyl-substituted MEA) are also included.
Table 1.
Measured absorption capacity CA at 40 °C for an amine concentration of 1.5 mol L−1 and initial absorption rate RIA at 40 °C and an amine concentration of 1.5 mol L−1 for aqueous solutions of PZ, 2,6-DMPZ, 2,5-DMPZ and synthesised amines HHPY, MHHPY, DMHHY and HHPZ. For comparison, the reactivity of conventional absorbents such as MEA, DEA and AMP (1.5 mol L−1, unless otherwise stated) are included.
| Amine | CA[a] | RIA[b] |
|---|---|---|
| PZ | 0.92 | 0.045 |
| 2,6-DMPZ | 0.86[c] | 0.025[d] |
| 2,5-DMPZ | 0.88 | 0.018[e] |
| HHPY | 0.85 | 0.032 |
| MHHPY | 0.86 | 0.018 |
| DMHHPY | 1.33 | 0.032 |
| HHPZ | 0 | 0 |
| MEA | 0.56[12], [f] | 0.027 |
| DEA | 0.60[12], [f] | 0.015 |
| AMP | 0.84[12], [f] | 0.006 |
Mol CO2/mol amine; data used to calculate CA were measured in the absorption reactor/FTIR system.
Mol CO2/mol amine, min−1; data used to calculate RIA were measured by microscale TGA. Initial absorption rates were calculated by using linear regression to determine the slope of the absorption capacity curve. R2≥0.995.
A precipitate formed during CO2 absorption/FTIR.
A precipitate formed during the CO2 and N2 runs of the TGA experiment.
A precipitate formed during the CO2 run of the TGA experiment. This could be mainly due to the evaporation of water.
3 mol L−1 concentration analysed.
The current industry-standard PCC amine MEA returned CA=0.56 mol CO2/mol amine and RIA=0.027 mol CO2/mol amine min−1. From the data amassed for PZ, 2,6-DMPZ, HHPY and DMHHPY in Table 1, superior CA and RIA values were observed for all these diamines relative to MEA. Superior CA values were also observed for 2,5-DMPZ and MHHPY, but with lower RIA values. HHPZ did not react with CO2, and DMHHPY was blended with DAP. Diamine CA values ranged from 0.85 (HHPY) to 0.92 (PZ) mol CO2/mol amine and RIA values from 0.018 (2,5-DMPZ) to 0.045 (PZ) mol CO2/mol amine min−1. While in absolute terms PZ was the standout pure diamine with the highest CA (0.92 mol CO2/mol amine) and RIA (0.045 mol CO2/mol amine min−1), CA and RIA are not the sole factors to be considered in determining the most efficient PCC diamine absorbent; aqueous solubility and stability of the carbamate also play a role. HPPY displays higher water solubility than PZ, on the basis of observations when preparing 1.5 mol L−1 amine solutions. HHPY was readily soluble at this concentration, as opposed to PZ, which required heating and stirring for dissolution. Additionally, HHPY displays high CA (0.85 mol CO2/mol amine) and RIA (0.032 mol CO2/mol amine min−1; Table 1) and showed clear evidence of formation of a hydrolysis-susceptible carbamate (see above and Figure 7).
The PZ analogues 2,6-DMPZ and 2,5-DMPZ displayed lower RIA values of 0.025 and 0.018 mol CO2/mol amine min−1, respectively. As these analogues differ only in the number of methyl substituents (PZ has none) and their positioning, these data suggested that introduction of methyl moieties had an adverse effect on the initial rate of CO2 absorption. 2,6-DMPZ has both methyl groups α to a single NH group, while 2,5-DMPZ has one methyl group α to each NH group. The measured RIA values indicate that the effect of addition of α-methyl groups is cumulative, with RIA dropping from 0.032 (PZ) to 0.025 (2,6-DMPZ) to 0.018 mol CO2/mol amine min−1 (2,5-DMPZ). Concurrent with the reduction in RIA was an increased prevalence towards HCO3− formation for 2,5-DMPZ (see above and Figure 6). The reactivity of 2,6-DMPZ towards CO2 was found to be similar to that of MEA, with the exception of a higher CA value. The propensity of 2,5-DMPZ for HCO3− formation was similar to that observed with MHHPY (see above and Figure 8), which was reflected in the almost identical CA (0.88 and 0.86 mol CO2/mol amine respectively) and RIA (0.018 and 0.018 mol CO2/mol amine min−1, respectively) values obtained for these amines. The reactivity of 2,6-DMPZ towards CO2 was found to be similar to that of MEA, with the exception of a higher CA value. 2,6-DMPZ was found to form predominantly carbamate on absorption of CO2 (Figure 5), similar to HHPY (Figure 7). While the propensity for carbamate hydrolysis and subsequent HCO3− formation is also similar to that observed with HHPY (cf. Figures 5 and 7), which was reflected in the almost identical CA (0.88 and 0.85 mol CO2/mol amine, respectively) values, 2,6-DMPZ returned a lower RIA value (0.025 and 0.032 mol CO2/mol amine min−1, respectively). Despite forming predominately HCO3−, the initial absorption rates obtained for both MHHPY and 2,5-DMPZ were much higher than that obtained for AMP and comparable to those of MEA and DEA (Table 1).
Of the diamines examined, DMHHPY exhibited the highest CA (1.1 mol CO2/mol amine) value and an RIA value higher than that of MHHPY and comparable to that of HHPY. This is an artefact of the serendipitous blending with DAP, which contributes significantly to the observed CO2 absorption capacity. Aqueous DAP has CA=0.95 mol CO2/mol amine. The bicarbonate-forming DMHHPY further promotes CO2 absorption, resulting in CA>1.0 mol CO2/mol amine. The 1° amino groups of DAP contribute towards DMHHPY’s increased initial reaction rate compared to MHHPY.
2.3. Effect of Structural Variations on Carbamate Structures
The effect of diamine structural variation on the ability to form stable carbamates was examined at the B3LYP/6-31+G** and MP2/6-31+G** levels of theory. Geometry optimisations were initially performed on PZ, 2,6-DMPZ, 2,5-DMPZ, HHPY, MHHPY, DMHHPY and HHPZ. Table 2 lists selected atomic properties including electrostatic potential (ESP) partial charges on the amino nitrogen atoms and the exposed area on the nitrogen atoms for these diamines. The trends in results obtained at the two levels of theory were found to be in good agreement with one another.
Table 2.
ESP charges and exposed areas on the nitrogen atoms [Å2] for optimised forms of the diamines analysed herein.
| Amine | ESP charge on N | Exposed area on N [Å2] | |||
|---|---|---|---|---|---|
| B3LYP | MP2 | B3LYP | MP2 | ||
| PZ | N1 | −0.584 | −0.640 | 4.71 | 4.80 |
| N2 | −0.584 | −0.640 | 4.71 | 4.80 | |
| 2,6-DMPZ | N1 | −0.718 | −0.752 | 4.21 | 4.25 |
| N2 | −0.752 | −0.778 | 4.70 | 4.82 | |
| 2,5-DMPZ | N1 | −0.746 | −0.785 | 4.45 | 4.54 |
| N2 | −0.746 | −0.785 | 4.45 | 4.54 | |
| HHPY | N1 | −0.874 | −0.907 | 4.91 | 4.96 |
| N2 | −0.874 | −0.907 | 4.91 | 4.96 | |
| MHHPY | N1 | −0.851 | −0.881 | 4.77 | 4.83 |
| N2 | -0.728 | -0.759 | 4.57 | 4.65 | |
| DMHHPY | N1 | −0.959 | −0.979 | 4.50 | 4.57 |
| N2 | −0.957 | −0.982 | 4.51 | 4.57 | |
| HHPZ | N1 | −0.525 | −0.551 | 6.82 | 6.89 |
| N2 | −0.386 | −0.402 | 5.71 | 5.77 |
Diamines can react with CO2 in aqueous solution to form three possible forms of carbamate species: amine carbamate (HNR1R2NCOO−), protonated amine carbamate (+H-HNR1R2NCOO−) and dicarbamate. Of these three forms, +HHNR1R2NCOO− was expected to be the main reaction product, with one amino group acting as the binding site for CO2 and the other as a proton acceptor. Geometry optimisations were next performed for the protonated amine-carbamate (+H-HNR1R2NCOO−) and amine-carbamate (HNR1R2NCOO−) species. For the lowest-energy conformer of each +HHNR1R2NCOO− and HNR1R2NCOO− derivative, Table 3 provides the calculated N–COO− bond length (rN–C [Å]), rC1–O1/rC1–O2 [Å] (Figure 12) and ESP partial negative charges on both oxygen atoms as a measure of charge delocalisation.
Table 3.
Calculated N–COO− bond lengths rN–C [Å], rC1–O1/rC1–O2 [Å] and ESP partial charge on both oxygen atoms for optimised geometries of the +HHNR1R2NCOO− and HNR1R2NCOO− derivatives of the subset of diamines analysed.
| Carbamate derivative | rN−C [Å] | rC–O1/rC–O2 [Å] | ESP charge on O1/O2 | |||
|---|---|---|---|---|---|---|
| B3LYP | MP2 | B3LYP | MP2 | B3LYP | MP2 | |
| H+-PZ-carbamate | 1.513 | 1.507 | 1.247/1.247 | 1.256/1.256 | −0.690/−0.690 | −0.681/−0.681 |
| PZ-carbamate | 1.471 | 1.477 | 1.257/1.257 | 1.264/1.264 | −0.743/−0.743 | −0.739/−0.739 |
| H+-2,6-DMPZ-carbamate[a] | 1.508 | 1.505 | 1.248/1.249 | 1.256/1.256 | −0.688/−0.689 | −0.680/−0.680 |
| 2,6-DMPZ-carbamate[a] | 1.469 | 1.477 | 1.258/1.258 | 1.264/1.264 | −0.772/−0.772 | −0.767/−0.767 |
| H+-2,6-DMPZ-carbamate[b] | 1.523 | 1.527 | 1.247/1.247 | 1.255/1.255 | −0.691/−0.692 | −0.699/−0.698 |
| 2,6-DMPZ-carbamate[b] | 1.461 | 1.463 | 1.260/1.260 | 1.266/1.266 | −0.753/−0.753 | −0.749/−0.749 |
| H+-2,5-DMPZ-carbamate[c] | 1.505 | 1.503 | 1.249/1.247 | 1.259/1.253 | −0.699/−0.665 | −0.702/−0.656 |
| 2,5-DMPZ-carbamate[c] | 1.465 | 1.470 | 1.259/1.258 | 1.266/1.264 | −0.750/−7.35 | −0.746/−0.731 |
| H+-HHPY-carbamate | 1.507 | 1.503 | 1.227/1.277[d] | 1.235/1.284[d] | −0.641/−0.735[d] | −0.625/−0.736[d] |
| HHPY-carbamate | 1.475 | 1.478 | 1.257/1.259 | 1.263/1.267 | −0.762/−0.767 | −0.744/−0.751 |
| H+- MHHPY-carbamate | 1.417 | 1.417 | 1.211/1.354[d] | 1.211/1.354[d] | −0.650/−0.772[d] | −0.640/−0.782[d] |
| MHHPY-carbamate | 1.463 | 1.469 | 1.258/1.260 | 1.264/1.266 | −0.753/−0.770 | −0.746/−0.759 |
| H+-DMHHPY-carbamate | 1.555 | 1.550 | 1.235/1.244 | 1.243/1.253 | −0.653/−0.699 | −0.648/−0.702 |
| DMHHPY-carbamate | 1.501 | 1.500 | 1.252/1.261 | 1.258/1.268 | −0.758/−0.819 | −0.743/−0.816 |
| H+-HHPZ-carbamate | 1.390 | 1.396 | 1.215/1.350[d] | 1.221/1.353[d] | −0.575/−0.660[d] | −0.566/−0.670[d] |
| HHPZ-carbamate | 1.460 | 1.470 | 1.254/1.263 | 1.260/1.267 | −0.741/−0.759 | −0.736/−0.758 |
Figure 12.

Chemical structural associated with Table 3 with regards to rN–C, rC1–O1/rC1–O2. a) 2,6-DMPZ (1. R2=R3=CH3, R1=R4=H and 2. R1=R4=CH3, R2=R3=H) and 2,5-DMPZ (R2=R4=CH3, R1=R3=H). b) HHPY (R1=R2=H), MHHPY (R1=CH3, R2=H) and DMHHPY (R1=R2=CH3). c) HHPZ.
As anticipated, methyl substitution significantly increased the partial negative charges on the amino groups of 2,6-DMPZ (N1 −0.718; N2 −0.752), 2,5-DMPZ (N1, N2 −0.746), MHHPY (N1 −0.851; N2 −0.728) and DMHHPY (N1 −0.959; N2 −0.957) relative to PZ (N1, N2 −0.584) and reduced the exposed area on the amino nitrogen atom of 2,6-DMPZ (N1 4.21 Å2; N2 4.70 Å2), 2,5-DMPZ (N1, N2 4.45 Å2), MHHPY (N1 4.77 Å2; N2 4.47 Å2) and DMHHPY (N1 4.50 Å2; N2 4.51 Å2) relative to PZ (N1, N2 4.71 Å2) at the B3LYP level. These changes in electronic effects both have impact on the resonance structure of the carboxylate moiety and hence overall stability of the carbamate derivative (see below).
Studies herein (Figure 3 and 4) demonstrated that PZ forms a hydrolysis-resistant NCOO− derivative, and thus the optimised geometries of H+-PZ-COO− and PZ-COO− were used as the baseline against which the remaining amine NCOO− derivatives were compared. For both H+-PZ-COO− and PZ-COO− resonance stabilisation of the carboxylate moiety is evident, with calculations showing identical charges on O1 and O2 as well as displaying identical rC–O values. The rC–O values of 1.247 and 1.257 Å reveal partial double-bond character for H+-PZ-COO− and PZ-COO−, respectively (Table 3). The N–COO− bond length of both PZ-COO− species was of single-bond character [standard single-bond rN–C in PZ is 1.466 Å (B3LYP) and 1.465 Å (MP2)]. H+-2,6-DMPZ-COO− and 2,6-DMPZ-COO− also exhibit this stable resonance structure, allbeit with slightly shorter N–COO− bond lengths. These findings are in keeping with our IR studies on 2,6-DMPZ and PZ (Figure 5), which gave very similar outcomes, with the exception of the emergence of a small HCO3− absorbance band. The protonated and unprotonated 2,6-DMPZ-COO− forms of isomer 2 (Figure 12), the minor reaction component, contributed to HCO3− formation.
H+-HHPY-COO− displays lower levels of charge delocalisation across the two oxygen atoms. Changes in charge distribution and bond length were noted with rC–O1=1.227 Å and rC–O2=1.277 Å, which were mirrored in the change in electron density at O1 (−0.641) and O2 (−0.735) (B3LYP). The shift in electron distribution was much less pronounced in the HHPY-COO− species with an rC–O1 of 1.257 Å and a rC–O2 of 1.259 Å which was mirrored in the change in electron density at O1 (−0.762) and O2 (−0.767) (B3LYP). The N–COO− bond lengths of H+-HHPY-COO− (1.507 Å) and HHPY-COO− (1.475 Å) are similar to that of the PZ-COO− species (1.471 Å). These findings are in keeping with our IR studies (Figure 7), in which HHPY was identified as forming a more labile NCOO− derivative that is more susceptible to hydrolysis than that of PZ. The lowest energy conformer obtained for H+-HHPY-COO−, as opposed to HHPY-COO− species, exhibited intramolecular hydrogen bonding between the COO− group and the NH2+ moiety. The low-energy conformers of H+-MHHPY-COO− and H+-HHPZ-COO− were also found to exhibit the same intramolecular hydrogen bonding. The resonance structure of the H+-MHHPY-COO− was less delocalised with rC–O1=1.211 Å and rC−O2=1.354 Å, which was mirrored in the changes in electron density at O1 (−0.650) and O2 (−0.772) (B3LYP). The N–COO− bond length of H+-MHHPY-COO− was found to be much shorter (1.417 Å). The shift in electron distribution of the carboxylate resonance structure was again much less pronounced in the MHHPY-COO− species compared to the H+-MHHPY-COO− species. MHHPY-COO− has a shorter N–COO− bond length (1.463 Å) than PZ-COO− (1.471 Å) and HHPY-COO− (1.475 Å). MHHPY forms predominantly HCO3− on absorption of CO2, as does 2,5-DMPZ. Both species display shorter N–COO− bonds and lower levels of resonance stabilisation.
In our IR studies DMHHPY was found to be representative of a blended amine system. Nonetheless, optimised geometries of the H+-DMHHPY-COO− and DMHHPY-COO− were still analysed, and both exhibited reduced resonance in the carboxylate moiety with rC–O1=1.235 Å and rC–O2=1.244 Å, which was mirrored in the changes in electron density at O1 (−0.653) and O2 (−0.699), and with rC–O1=1.252 Å and rC–O2=1.261 Å, which was mirrored in the changes in electron density at O1 (−0.758) and O2 (−0.819) (B3LYP), respectively. Given the structural similarity of DMHHPY and MHHPY, DMHHPY was expected to form predominantly HCO3− on absorption of CO2.
Experimentally HHPZ was unreactive towards CO2. Calculations revealed H+-HHPZ-COO− to have a significantly shorter N–COO− bond length of 1.390 Å (significant double-bond character), as well as the largest displacement in electron distribution of the carboxylate resonance structure with rC−O1=1.215 Å and rC–O2=1.350 Å, which was mirrored in the changes in electron density at O1 (−0.575) and O2 (−0.660) (B3LYP). This was much less pronounced in the HHPZ-COO− species; nonetheless, in a diamine system it is typical for one amino group to act as binding site for CO2 while the other is protonated. These data support our experimental observations.
3. Conclusions
A series of heterocyclic diamines (PZ, 2,6-DMPZ, 2,5-DMPZ, HHPY, MHHPY, DMHHPY and HHPZ) have been evaluated as potential PCC absorbents by in situ ATR-FTIR spectroscopy. Of these diamines, PZ displayed both the highest CO2 absorption capacity (CA=0.92 mol CO2/mol amine) and highest initial absorption rate (RIA=0.045 mol CO2/mol amine min−1). These values represent a significant enhancement over currently used amines such as MEA. PZ forms a hydrolysis-resistant carbamate, as well as a dicarbamate. This behaviour is unique to PZ. Hydrolysis of the carbamate derivative of HHPY was observable in the IR spectra collected during CO2 absorption. HHPY displayed similar CO2 absorption characteristics to PZ, but with a higher propensity for HCO3− formation. The introduction of α-methyl substituents increased the propensity towards carbamate hydrolysis and HCO3− formation. Additionally α-methyl substitution decreased RIA, with PZ analogues 2,6-DMPZ and 2,5-DMPZ displaying lower RIA values of 0.025 and 0.018 mol CO2/mol amine min−1, respectively. Increasing the number of methyl groups α to the NH group also increases the rate of HCO3− formation. Despite forming predominately HCO3−, the RIA of MHHPY (0.018 mol CO2/mol amine min−1) was much higher than that of the corresponding α-dimethyl substituted 1° amine AMP (RIA=0.006 mol CO2/mol amine min−1) and comparable with that of the industrially relevant MEA and DEA. The serendipitously blended DAP/DMHHPY exhibited the highest CA (1.1 mol CO2/mol amine) and excellent RIA (0.032 mol CO2/mol amine min−1). HHPZ was found to be relatively unreactive towards CO2. In all instances our calculations at the B3LYP/6-31+G** and MP2/6-31+G** levels of theory supported our experimental observation. Finally, we propose that HHPY offers the best compromise between high CO2 absorption capacity, carbamate formation, hydrolysis to HCO3− and water solubility for future use in model, and potentially pilot-scale, PCC systems.
Experimental Section
General: All starting materials were purchased from Sigma Aldrich and used without further purification. Solvents were bulk and distilled prior to use. 1H and 13C NMR spectra were recorded on a Bruker Avance AMX 300 MHz spectrometer at 300.1315 and 75.4762 MHz, respectively. Chemical shifts δ are reported relative to internal standards. Mass spectra were recorded on a Shimadzu LCMS-2010 EV spectrometer and obtained by the ESI method. IR spectra were recorded by ATR-FTIR on a Mettler-Toledo ic10 FTIR: spectrometer.
Preparation of Hexahydropyrimidine (HHPY): Formaldehyde (37 wt % solution, 1.5 mol, 126 g) was added dropwise to an ice-cooled, stirred aliquot of anhydrous 1,3-diaminopropane (1 mol, 74.1 g) over 30 mins. The reaction mixture was then stirred for 24 h at room temperature and cooled in an ice bath, and NaOH was added (1 mol, 40 g). The organic layer was transferred to a Dean–Stark apparatus and azeotropically distilled with cyclohexane (100 mL). The cyclohexane was removed in vacuo and the residue fractionally distilled to afford anhydrous hexahydropyrimidine (17 g, 20 %) as a clear oil (b.p. 57–60 °C/27 mbar, lit. [25, 27]: b.p. 58–60 °C/20 mm Hg). 1H NMR (300 MHz, CDCl3): δ=1.36 (2 H, m), 1.96 (2 H, br s), 2.82 (4 H, t, J=5.5 Hz), 3.63 ppm (2 H, s); 13C NMR (75 MHz, CDCl3): δ=28.61, 45.65, 62.79 ppm; MS (ESI+): m/z 87 (M+1); FTIR: νNH 3267 cm−1.
Preparation of 2-Methylhexahydropyrimidine (MHHPY): Acetaldehyde (0.215 mol, 9.5 g) in diethyl ether (100 mL) was added dropwise to ice-cooled 1, 3-diaminopropane (0.2 mol, 14.8 g). The reaction mixture was then stirred over K2CO3 (0.4 mol, 55.4 g) for 24 h at room temperature. The solvent was removed in vacuo and the residue fractionally distilled to afford 2-methylhexahydropyrimidine (17.5 g, 87 %) as a clear oil (b.p. 56–59 °C/30 mbar, lit. [28] b.p. 60 °C/30 mm Hg). 1H NMR (300 MHz, CDCl3) δ=0.80 (3 H, d, J=6.0 Hz), 1.09 (2 H, m), 2.48 (2 H, m), 2.76 (4 H, m), 3.25 ppm (1 H, q, J=6.0 Hz); 13C NMR (75 MHz, CDCl3) δ=22.75, 26.80, 45.41, 67.09 ppm; MS (ESI+: m/z 101 [M+1]; FTIR: νNH 3266 cm−1.
Preparation of 2, 2-Dimethylhexahydropyrimidine (DMHHPY): A solution of acetone (0.215 mol, 12.5 g) in diethyl ether (100 mL) was added dropwise to ice-cooled 1,3-diaminopropane (0.2 mol, 14.83 g). The reaction mixture was then stirred over K2CO3 (0.4 mol, 55.4 g) for 24 h at room temperature. The solvent was removed in vacuo and the residue fractionally distilled to afford 2, 2-dimethylhexahydropyrimidine (16.17 g, 71 %) as a clear oil (b.p. 50–54 °C/25 mbar, lit. [28]: b.p. 65 °C/25 mm Hg). 1H NMR (300 MHz, CDCl3): δ=0.90 (6 H, s), 1.05 (2 H, m), 1.45 (2 H, s), 2.60 ppm (4 H, t, J=5.7 Hz); 13C NMR (75 MHz, CDCl3): δ=27.26, 36.87, 39.99, 64.31 ppm; MS (ESI+): m/z 115 [M+1]; FTIR: νNH 3271,  1602 cm−1.
Preparation of Hexahydropyridazine (HHPZ): Dibromobutane (0.1 mol, 21.6 g) was added dropwise to a stirred solution of diethylhydrazine dicarboxylate (0.1 mol, 17.6 g), K2CO3 (0.2 mol, 27.7 g) and acetonitrile (100 mL) at room temperature. The reaction mixture was then heated to reflux for 24 h, cooled and filtered. The solvent was removed in vacuo and the residue fractionally distilled to afford 1, 2-dicarbethoxyhexahydropyridazine (18.5 g, 80 %) as a clear oil (b.p. 110–114 °C/2–3 mbar, lit. [29]: 106–114 °C/3 mm Hg). 1H NMR (300 MHz, CDCl3): δ=1.07 (6 H, m), 1.49 (4 H, s), 2.74 (4 H, br s), 3.97 ppm (4 H, m); 13C NMR (75 MHz, CDCl3): δ=14.36, 23.19, 44.76, 61.93, 155.15 ppm; MS (ESI+): m/z 231 [M+1]; FTIR: νC=O 1706 cm−1.
1, 2-Dicarbethoxyhexahydropyridazine (0.13 mol, 30.1 g) was added to a solution of NaOH (0.72 mol, 20.8 g), water (20 mL) and methanol (150 mL). The reaction mixture was then heated to reflux for 20 h, cooled and the precipitated inorganic salt removed by filtration. The filtrate was heated to reflux for a further 20 h, cooled, filtered and the solvent removed in vacuo. The residue was extracted with dichloromethane (40 mL×3), concentrated in vacuo and fractionally distilled to afford hexahydropyridazine (6.75 g, 60 %) as a yellow oil (b.p. 38–40 °C/11 mbar, lit. [30]: b.p. 38 °C/8 mm Hg). 1H NMR (300 MHz, MeOD): δ=2.39 (4 H, m), 3.73 (4 H, m), 5.72 ppm (2 H, s); 13C NMR (75 MHz, MeOD): δ=23.06, 47.00 ppm; MS (ESI+): m/z 87 [M+1]; FTIR: νNH 3269 cm−1.
Microscale Thermogravimetric Analysis (TGA): A Setaram Labsys TG-DTA/DSC thermogravimetric analyser (TGA) was used in isothermal mode at 40 °C to analyse aqueous CO2/amine reactivity on a microscale (100 μL). 1.5 mol L−1 aqueous amine solutions were exposed to a gas stream of 15 vol % CO2 (>99.9 % purity, BOC Australia) in N2 at atmospheric pressure. A gas flow rate of 30 mL min−1 was used for all experiments.
To determine total CO2 uptake two separate TGA experiments were performed for each amine. The first experimental run determined the mass loss due to evaporation when the test solution was exposed to a 100 % N2 gas stream. The second experimental run determined the mass increase of the test solution when exposed to CO2 (15 vol % CO2 in N2 gas stream) over the same length of time. Each experiment was performed on a fresh 100 μL aliquot of the test solution in a 100 μL alumina crucible (Setaram). From the data collected an absorption curve was then calculated for each amine by subtracting the mass at time t of the evaporation run from the mass at time t of the absorption run. Initial absorption rates could then be calculated by using linear regression to determine the slope of the absorption curve.
Absorption/FTIR Experiments: The absorption reactor apparatus used to analyse aqueous CO2/amine reactivity has been described previously.[10] Briefly, a gas stream of 13 vol % CO2 (>99.9 % purity, BOC Australia) in N2 with a flow rate of 1.8 L min−1 was bubbled through a 1.5 mol L−1 aqueous amine solution in a glass reactor vessel, maintained at 40 °C by a temperature-controlled water bath (Techne). The CO2 content of both the gas inflow and outflow was measured by using a Horiba VA 3000 CO2 analyser. The difference between the CO2 concentration of the reactor gas inflow and gas outflow was used determine the amount of CO2 absorbed by the amine solution (mol CO2/mol amine). Each experiment was run until the measured CO2 concentration in the outflow returned to the original percentage value, that is, equilibrium was reached. A typical run lasted between 45 and 90 mins. Solution volumes of 30 mL were used for all experiments.
For the duration of each absorption experiment an ATR diamond-tipped IR probe, coupled via a mirrored K6 conduit to an ic10 FTIR spectrometer (Mettler-Toledo), was immersed in the aqueous amine solution. In situ IR measurements were obtained simultaneously with the CO2 absorption measurements, with the FTIR spectrometer set to continuously collect spectra for the duration of the absorption experiment over the spectral range of 4000–650 cm−1. Each spectrum was recorded as the average of 256 scans over a sampling interval of fifteen seconds with a resolution of 4 cm−1. The amines investigated were synthesised according to the procedures detailed above, with the exception of commercially available PZ, 2,6-DMPZ and 2,5-DMPZ (Sigma-Aldrich).
Computational Details: The computational software package Spartan ‘08 was used to calculate and compare optimised geometries (gas phase) of the heterocyclic diamines and their carbamate derivatives.[22] First, molecular mechanics calculations using the MMFF94 force field and Monte Carlo search algorithm were used to obtain a set of low-energy conformers for each amine and carbamate molecule. Each subset of low-energy conformers were then re-submitted as a geometry optimisation at the B3LYP/6-31+G** and MP2/6-31+G** levels to obtain an equilibrium geometry corresponding to an energy minimum (characterized by a gradient <0.001). Vibrational analysis was performed for all optimised geometries to ensure that they correspond to local minima, that is, there are no imaginary frequencies.
Acknowledgments
This project is part of the CSIRO Coal Technology Portfolio and received funding from the Australian Government as part of the Asia-Pacific Partnership on Clean Development and Climate. The views expressed herein are not necessarily the views of the Commonwealth, and the Commonwealth does not accept responsibility for any information or advice contained herein.
References
- 1.Canadell JG, Le Quere C, Raupach MR, Field CB, Buitenhuis ET, Ciais P, Conway TJ, Gillett NP, Houghton RA, Marland G. Proc. Natl. Acad. Sci. USA. 2007;104:18866–18870. doi: 10.1073/pnas.0702737104. [DOI] [PMC free article] [PubMed] [Google Scholar]
- 2.Raupach MR, Marland G, Ciais P, Le Quere C, Canadell JG, Klepper G, Field CB. Proc. Natl. Acad. Sci. USA. 2007;104:10288–10293. doi: 10.1073/pnas.0700609104. [DOI] [PMC free article] [PubMed] [Google Scholar]
- 3.CO2CRC, CSIRO. Sate of the Art Review: National Post Combustion Capture and Storage Demonstration Program. Revision 2-1, PCC Ltd, Australia.
- 4.International Energy Agency. IEA Greenhouse Gas R&D Programme: CO2 Capture Ready Plants. 2007. http://www.iea.org/publications/free_all_papers.asp.
- 5.Gielen D, Podkanski J, Unander F. Energy Technology Analysis: Prospects for CO2. Paris: International Energy Agency (IEA); 2004. Capture and Storage. [Google Scholar]
- 6.Blomen E, Hendriks C, Neele F. Energy Procedia. 2009;1:1505–1512. [Google Scholar]
- 7.Wang M, Lawal A, Stephenson P, Sidders J, Ramshaw C. Chem. Eng. Res. Des. 2011;89:1609–1624. [Google Scholar]
- 8.Davison J. Energy. 2007;32:1163–1176. [Google Scholar]
- 9.Finkenrath M. Cost and Performance of Carbon Dioxide Capture from Power Generation. 2011. IEA Energy Papers, No. 2011/05.
- 10.Robinson K, McCluskey A, Attalla M. ChemPhysChem. 2011;12:1088–1099. doi: 10.1002/cphc.201001056. [DOI] [PubMed] [Google Scholar]
- 11.Fauth DJ, Filburn TP, Gray ML, Hedges SW, Hoffman J, Pennline HW, Filburn T. Abstr. Pap. Air and Waste Management Association 100th Annual Conference and Exhibition. Pittsburgh; 2007. [Google Scholar]
- 12.Bonenfant D, Mimeault M, Hausler R. Ind. Eng. Chem. Res. 2003;42:3179–3184. [Google Scholar]
- 13.da Silva EF, Svendsen HF. Ind. Eng. Chem. Res. 2006;45:2497–2504. [Google Scholar]
- 14.Vaidya PD, Kenig EY. Chem. Eng. Technol. 2007;30:1467–1474. [Google Scholar]
- 15.Donaldson TL, Nguyen YN. Ind. Eng. Chem. Fund. 1980;19:260–266. [Google Scholar]
- 16.Versteeg GF, Van Dijck LAJ, Van Swaaij WPM. Chem. Eng. Commun. 1996;144:113–158. [Google Scholar]
- 17.Robinson K, Jackson P, Attalla M. 2009. Abstr. Pap. CHEMECA 2009, Perth, Australia.
- 18.Chakraborty AK, Bischoff KB, Astarita G, Damewood JJR. J. Am. Chem. Soc. 1988;110:6947–6954. [Google Scholar]
- 19.Sartori G, Savage DW. Ind. Eng. Chem. Fund. 1983;22:239–249. [Google Scholar]
- 20.Bishnoi S, Rochelle GT. Chem. Eng. Sci. 2000;55:5531–5543. [Google Scholar]
- 21.Ermatchkov V, Pérez-Salado Kamps É, Maurer G. J. Chem. Thermodyn. 2003;35:1277–1289. [Google Scholar]
- 22. Wavefunction Inc, Q-chem Inc, Spartan ‘08 for Windows, Macintosh and Linux, Irvine, CA, 2008.
- 23.Jensen HH, Lyngbye L, Jensen A, Bols M. Chem. Eur. J. 2002;8:1218–1226. doi: 10.1002/1521-3765(20020301)8:5<1218::aid-chem1218>3.0.co;2-x. [DOI] [PubMed] [Google Scholar]
- 24.Khalili F, Henni A, East ALL. J. Chem. Eng. Data. 2009;54:2914–2917. [Google Scholar]
- 25.Evans RF. Aust. J. Chem. 1967;20:1643–1661. [Google Scholar]
- 26.Edwards J, Ormsby D. 2008. Organic Bases, http://ifs.massey.ac.nz/outreach/resources/chem/orgbases.php.
- 27.Locke JM, Crumbie RL, Griffith R, Bailey TD, Boyd S, Roberts JD. J. Org. Chem. 2007;72:4156–4162. doi: 10.1021/jo0704863. [DOI] [PubMed] [Google Scholar]
- 28.Zelenin KN, Alekseyev VV, Ukraintsev IV, Tselinsky IV. Org. Prep. Proced. 1998;30:53–61. [Google Scholar]
- 29.Nakayama T. 1992. (Ihara Chemical Industry Co., Ltd.), EP 519083-A.
- 30.Sugiyama T. 1995. (Ihara Chemical Industry Co., Ltd.), EP 693482-A.


