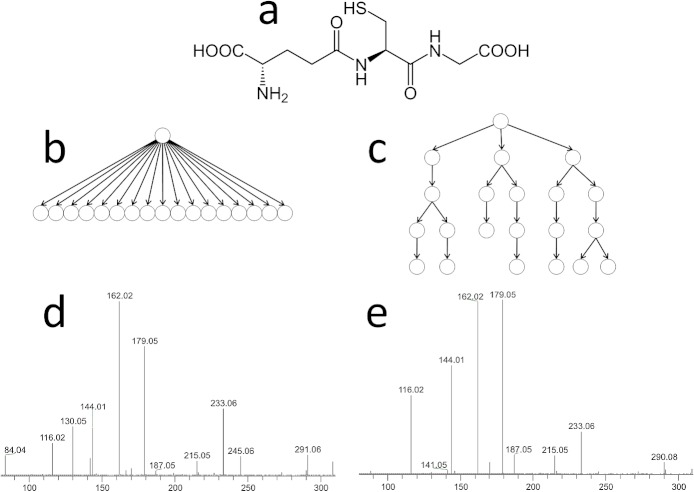
Figure 1.
Comparison of MS/MS and MSn fragmentation spectra of glutathione. Schematic hierarchical representation of precursor-product relationships between ions derived from hierarchy of spectra in (b) MS/MS and (c) MSn of glutathione(CHEBI:16856) (a). The corresponding spectra are (d) MS/MS spectrum and (e) total composite spectrum of MSn experiment. The major differences between the two spectra lie in the different signal intensity ratio; most of the fragments (except 84 m/z) were observed in both spectra.

