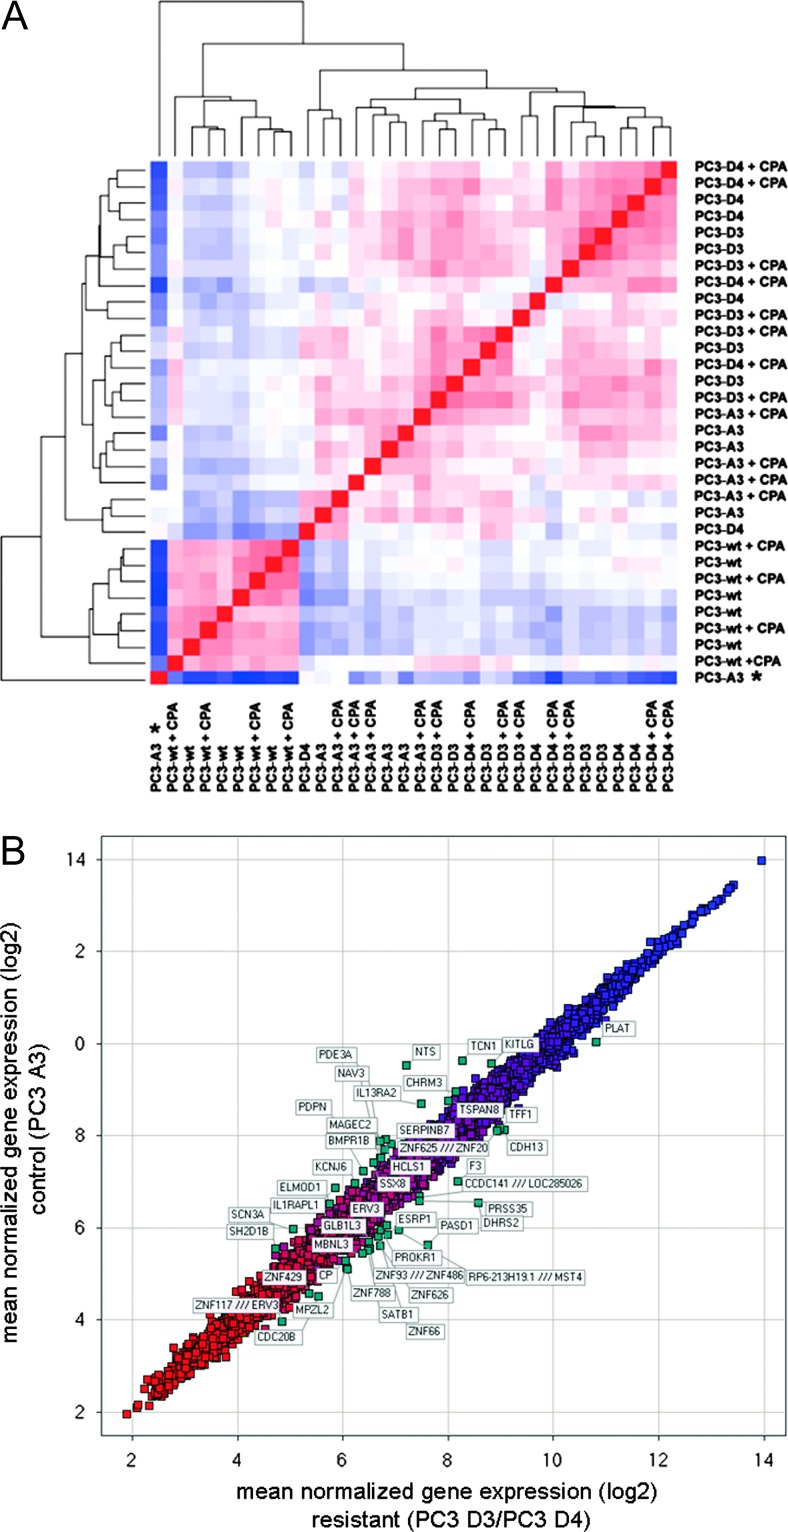
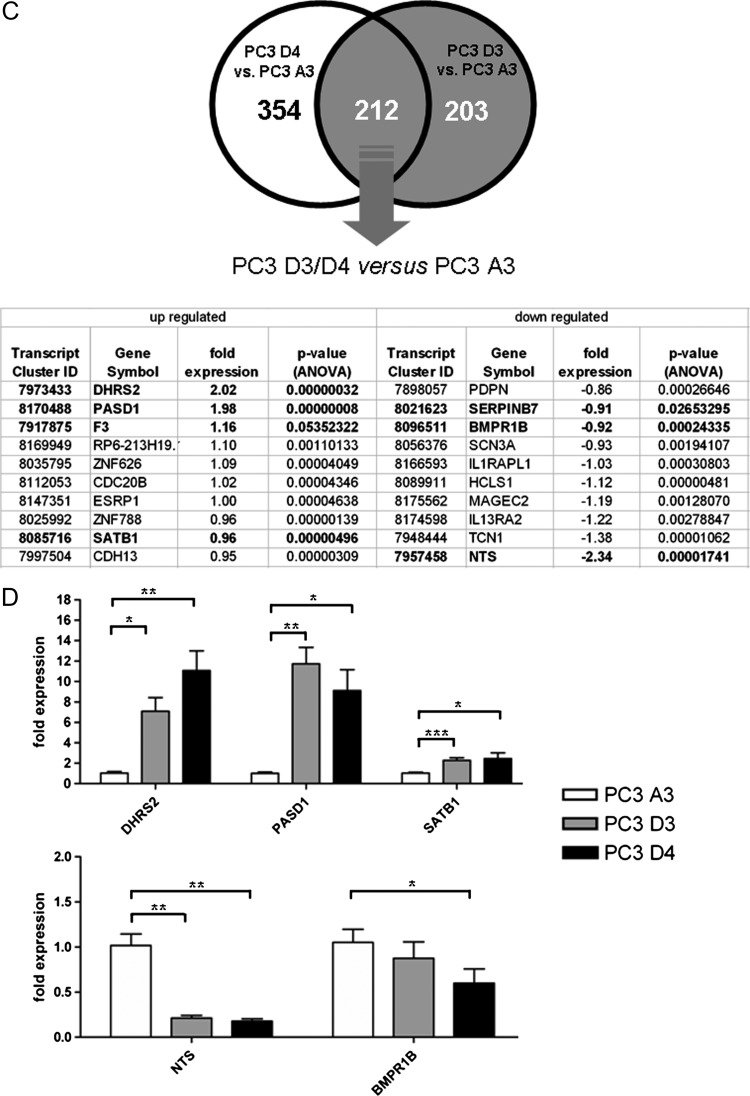
Figure 1.
Gene expression of the resistant tumors PC3 D3 and PC3 D4. (A) Hierarchical clustering on RMA normalized arrays (four tumors per group). Red, low distance; blue, high distance. Outliners, marked by an asterisk, are excluded from further data analysis. (B) Scatter plot of mean normalized gene expression (log2) PC3 D3/PC3 D4 versus PC3 A3. (C) Venn diagram of PC3 D4 versus A3 and PC3 D3 versus A3 differentially expressed genes (cutoff = 0.4 relative expression change) and table including the top 10 of genes differentially expressed by both PC3 D3 and PC3 D4. Bold, qPCR-validated genes. (D) Validation of differentially expressed genes by qPCR (fold expression to control PC3 A3): DHRS2, PASD1, SATB1 homeobox 1 (SATB1), NTS, and BMPR1B. *P < .05, **P < .005, ***P < .0005 (t test).


