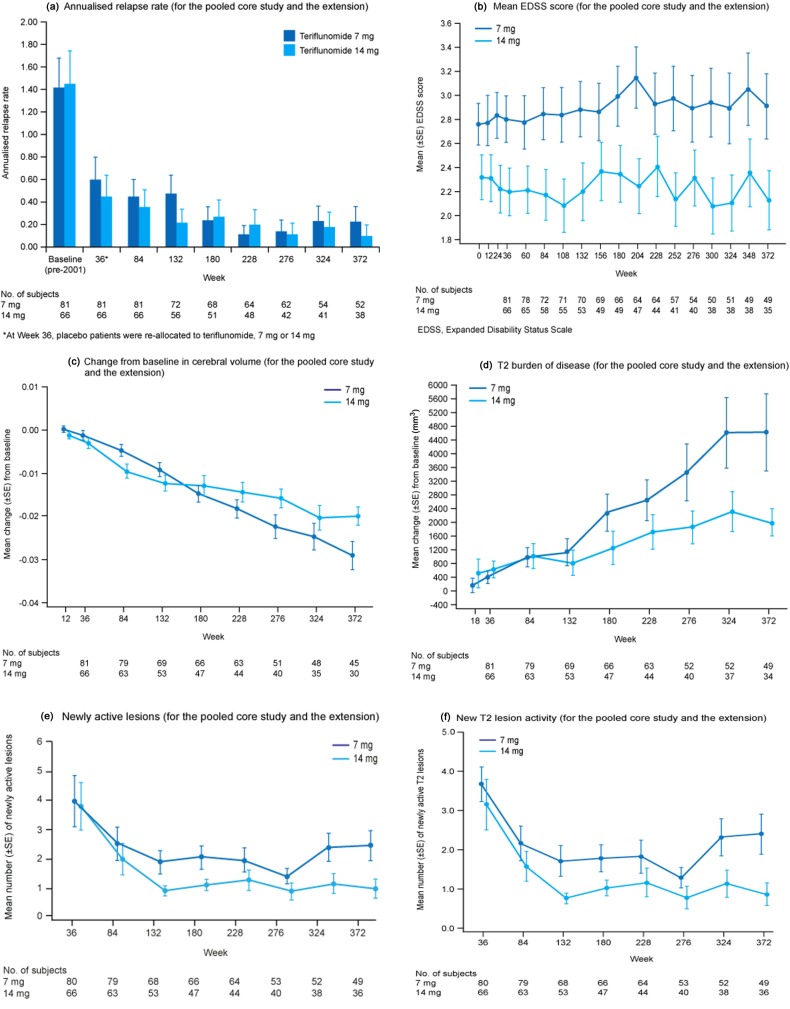
Figure 2.
(a) Annualised relapse rate (for the pooled core study and the extension); (b) mean EDSS score (for the pooled core study and the extension); (c) change from baseline in cerebral volume (for the pooled core study and the extension); (d) T2 burden of disease (for the pooled core study and the extension); (e) newly active lesions (for the pooled core study and the extension) and (f) new T2 lesion activity (for the pooled core study and the extension).

