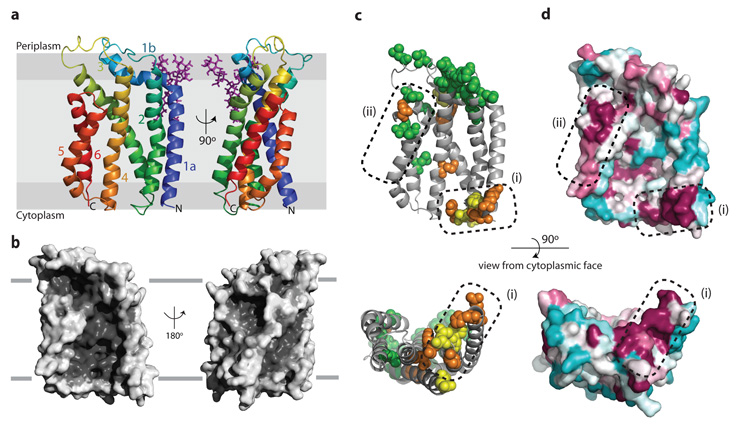
Figure 2. Structure of A. aeolicus TatC.
a, Cartoon representation of AaTatC coloured from blue at the N-terminus to red at the C-terminus. The position within the membrane bilayer is predicted by MD simulations (Supplementary Fig. 5). A semi-ordered molecule of LMNG detergent is present and is shown in purple. b, Surface representation of the AaTatC structure. The left hand views in a and b are the same orientation. c, Positions of inactivating substitutions in EcTatC identified by genetic screening32 (green), targeted substitution17,34 (orange), or both (yellow), mapped to AaTatC (full details in Supplementary Table 2). d, Sequence conservation at the surface of TatC displayed in the Consurf46 colouring scheme in which maroon represents high, and cyan low, sequence conservation. c, d, Dotted regions labelled (1) and (2) highlight conserved functional regions of the structure.

