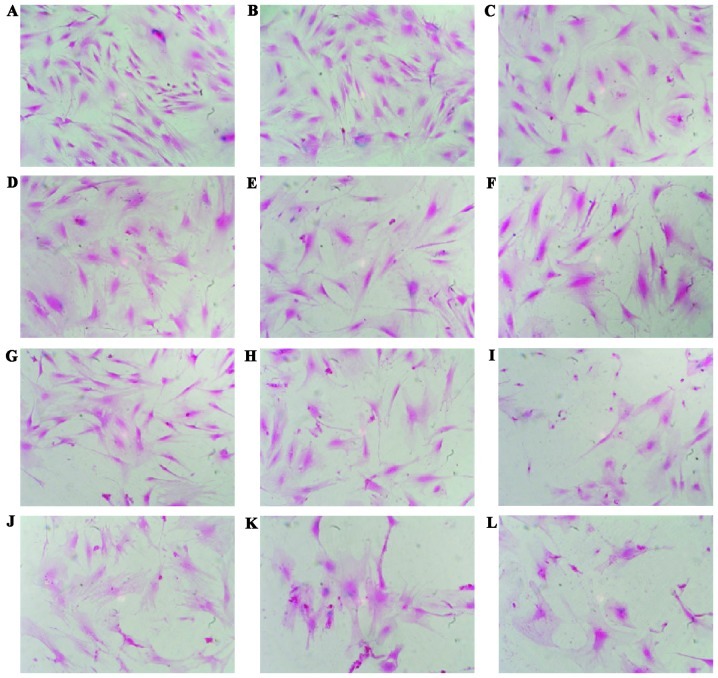
Figure 2.
Morphological change in MGFs subsequent to treatment with H2O2 is shown. MGFs were (A) non-treated and (B–L) treated with various concentrations of H2O2. H2O2-treated cells showed a round shape with enlarged nuclei and expanded cytoplasm. A decrease in the cell number was evident in the H2O2-treated samples. (A) Non-treated, (B) 50 μM, (C) 100 μM, (D) 150 μM, (E) 200 μM, (F) 250 μM, (G) 300 μM, (H) 350 μM, (I) 400 μM, (J) 450 μM, (K) 500 μM and (L) 550 μM.

