Figure 1.

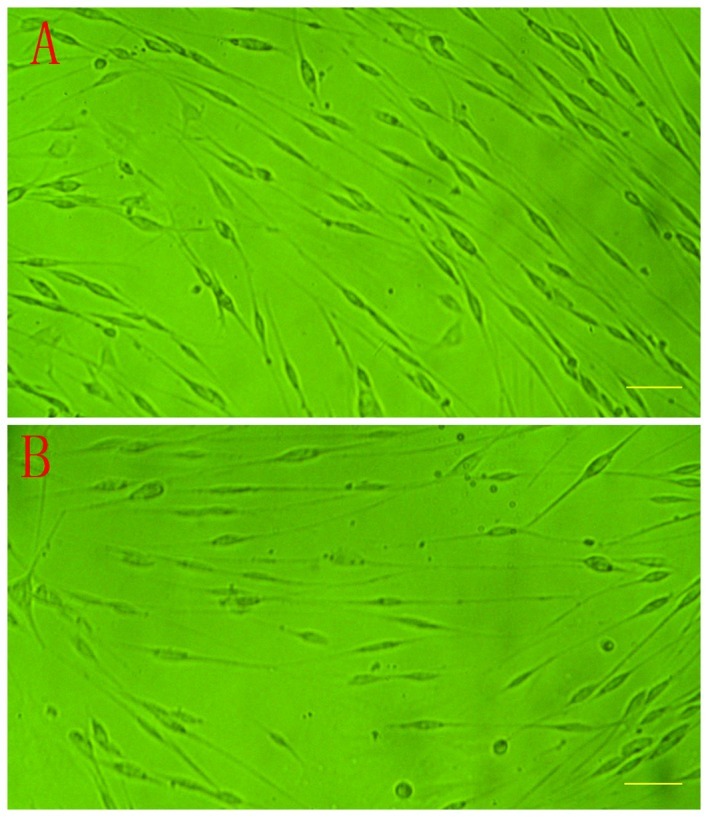
Phase-contrast photomicrographs of cultured cells. (A) Population of SCs after purification. (B) Population of hTERT-SCs after selection with 400 μg/ml G418. Bars, 50 μm.

Phase-contrast photomicrographs of cultured cells. (A) Population of SCs after purification. (B) Population of hTERT-SCs after selection with 400 μg/ml G418. Bars, 50 μm.