Figure 3.
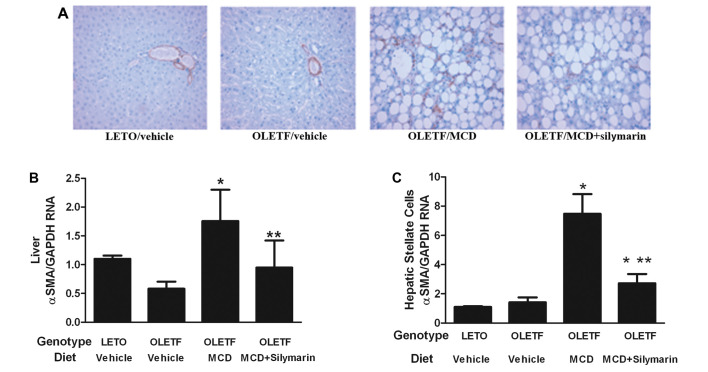
Evaluation of hepatic stellate cell (HSC) activation. (A) Immunohistochemical evaluation showed increased α-SMA positive cells in the liver of OLETF/MCD. The number decreased in OLETF/MCD+silymarin rats. Data are presented as the number of α-SMA positive cells in 30 40x fields (1.3 mm2, approximately 3,000 hepatocytes). (B) Analysis of α-SMA mRNA expression in the liver; the results are compatible to these of the immunohistochemical study. (C) Analysis of α-SMA mRNA expression in HSCs, isolated from the experimental animals; the results are in accordance with those of the whole liver study. *P<0.05 compared to LETO/vehicle. **P<0.05 compared to OLETF/MCD.

