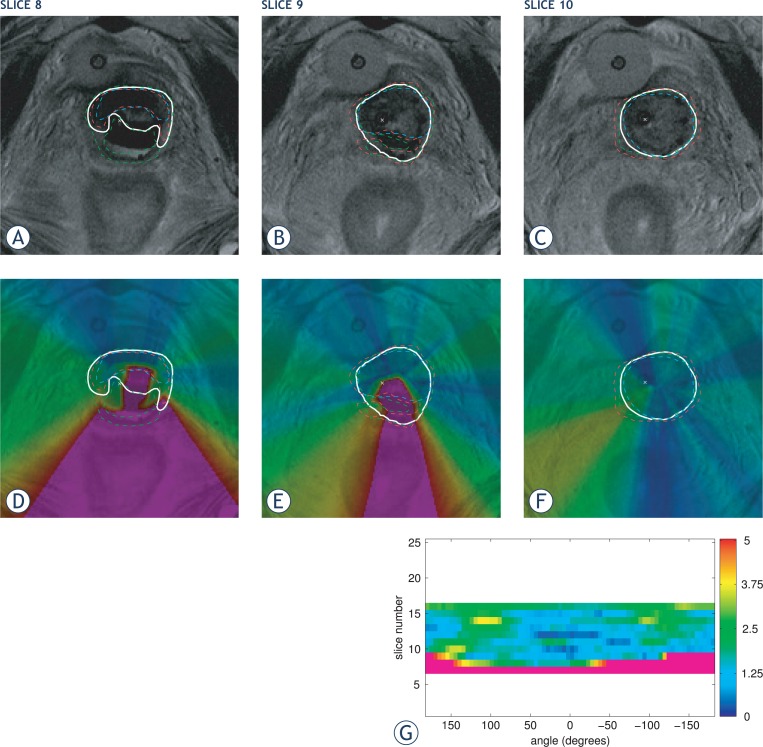
FIGURE 3.
An example of contouring analysis from the field of brachytherapy. The reference contours are in images shown with thicker white line and the analyzed contours with thinner dashed ones. The small cross represents the center of the uterine tandem and is used as the contour center for the angular analysis. The top row (a–c) shows selected slices of the original image, the second row (d–f) is image representation of distance deviations and at the bottom (g) is an angular representation of distance deviations for all image slices. Here, the angle of zero degrees corresponds to the anterior direction (top of the image), negative angles to the right hand side of the body (right hand side of the image) and positive values to the left hand side of the body (left hand side of the image). The color scale of image representation equals the one of angular representation; black/purple represents contour discrepancy greater than 5mm. The overall maximal distance deviation (DDR,max) equals 17.96 mm and the mean distance deviation ( ) equals 2.17 mm.

