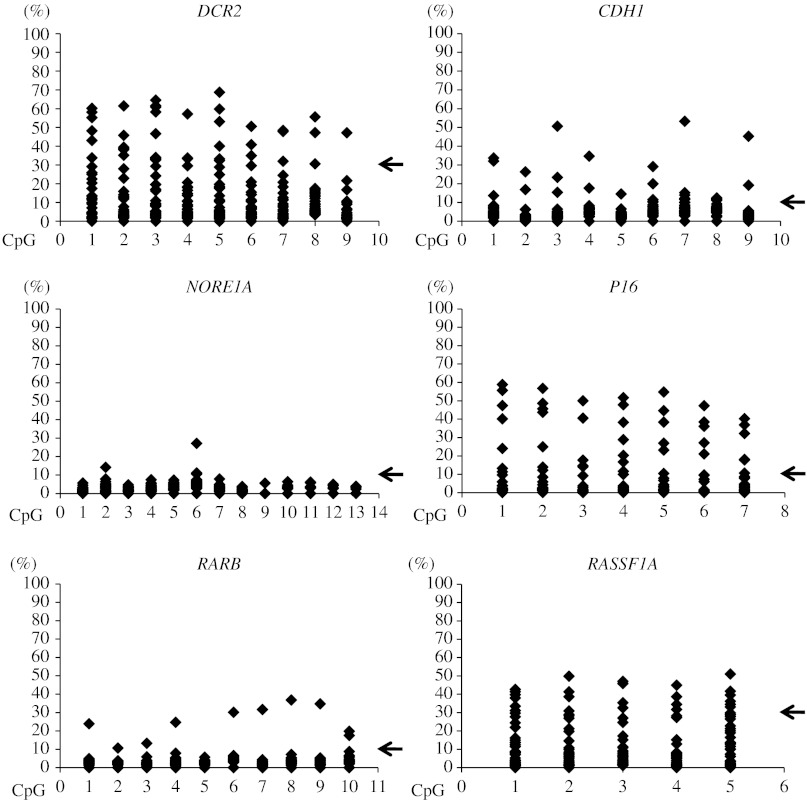
Figure 1.
Methylation densities of promoter regions for individual tumor suppressor genes measured by pyrosequencing for pheochromocytomas and paragangliomas in Series A. Scatterplots illustrate methylation levels (%) at individual CpG sites assayed in each tumor sample. Cutoff levels for hypermethylation determined from normal adrenal medulla are indicated by arrows for DCR2 (>30%), CDH1 (>10%), NORE1A (>10%), P16 (>10%), RARB (>10%), and RASSF1A (>30%).

