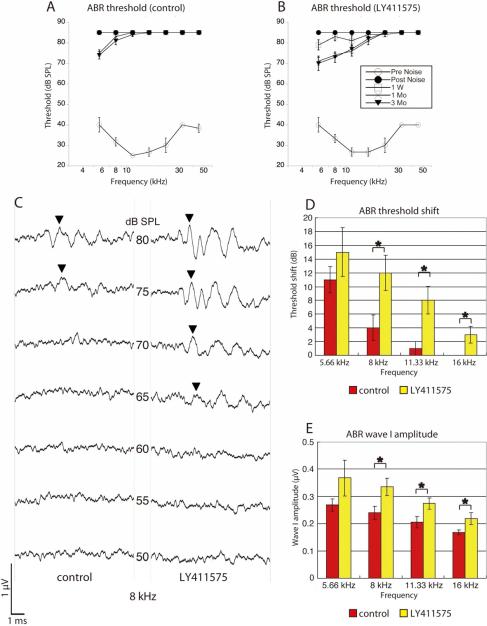
Figure 6. Measurement of ABR in deafened ears after LY411575 treatment.
(A, B) A decrease in ABR thresholds at low frequencies (up to 16 kHz) in the left, LY411575-treated ear (B) compared to the right, control ear (A) was apparent in ABR thresholds in recordings made at 7 frequencies from 5.66 to 45.25 kHz with the following time course. Before noise exposure (Pre Noise: open circles), 1 d after noise exposure (Post Noise: filled circles), 1 week after drug treatment (1 W: open squares), 1 month after treatment (1 Mo: crosses), and 3 months after treatment (3 Mo: filled triangles) (n = 5 in each group). When no response was observed at 80 dB (maximum acoustic output of the system) the threshold was designated as 85 dB.
(C) An example of 8 kHz ABR waves recorded 3 months after drug treatment from the same mouse. Arrowheads show the peaks with the largest peak-to-peak amplitude. In the LY411575-treated ear, the peak could first be detected at 65 dB, while on the control side the peak could first be detected at 75 dB.
(D, E) The differences in threshold (D) and wave I amplitude (E) 3 months after drug treatment compared to 1 d after noise exposure between control and LY411575-treated ears at 8, 11.33, and 16 kHz (asterisks) were significant (n = 5 in each group).
Error bars are standard error of the mean.

