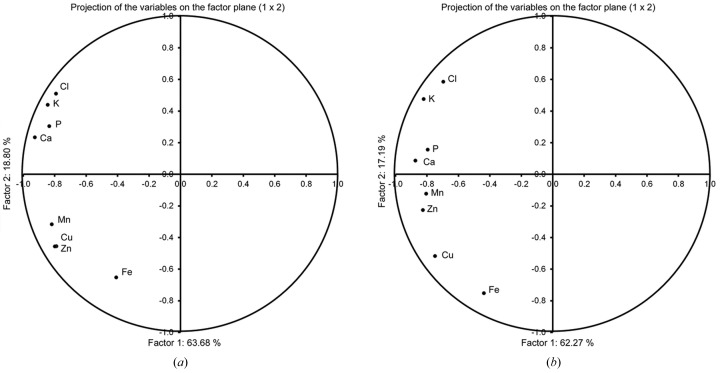
Figure 2.
Principal component analysis plots. The images from Fig. 1 ▶ were used as the input data. The first and second principal components are presented, (a) for the twisted internode and (b) for the straight internode. Grouping of elements was based on second principal component values.

