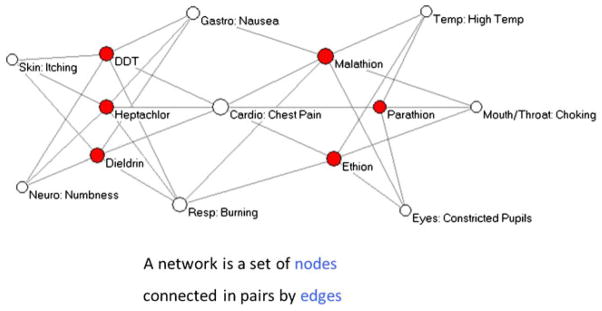
Fig. 1.

Network basics. A simple network is composed of nodes and edges. Here the network attempts to describe the relationship between the drug and clinical reaction. Red nodes denote the drug. The white nodes denote the reaction. The edges connect the nodes. White nodes (reaction) are distributed in space according to their degree of association to the red nodes (chemical agent). By this representation subsets of reactions and drugs can be identified. For example, it appears that DDT, Hepatachor, and Dieldrin can lead to similar side effects
