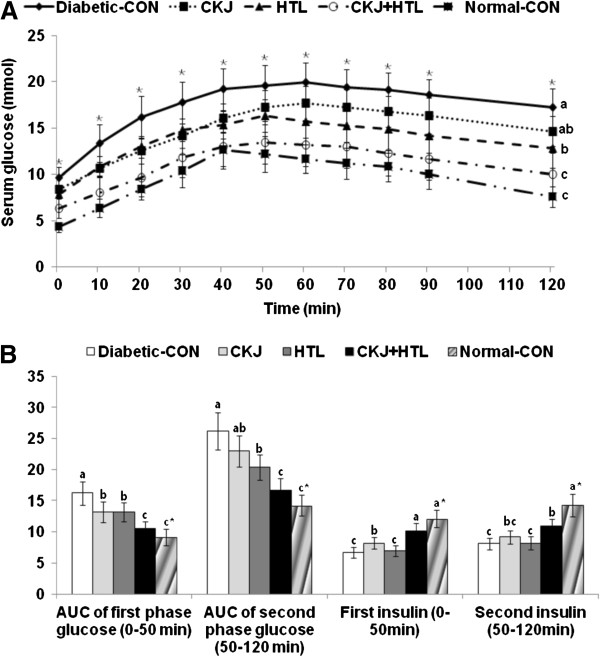
Figure 1.

Serum glucose levels (A) and the area under the curve of serum glucose and insulin (B) during oral glucose tolerance tests. Serum glucose time course (A) and area under the curve (AUC) for glucose and insulin in non-diabetic Sham and diabetic Px rats fed high fat diets with casein (normal-control and diabetic-control groups, respectively), 5% CKJ, 5% HTL, or 5% CKJ+ 5% HTL for 8 wk, following oral loading with 2 g glucose per kg bw. Normal-CON group represented non-diabetic Sham rats fed high fat diets with casein. The sample size was the same as in Table 3. The bars represent mean±SD. *Significantly different among the groups at p<0.05 by one-way ANOVA. a,b,cValues in the same row with different superscripts were significantly different in Tukey test at P<0.05.
