Figure 1.

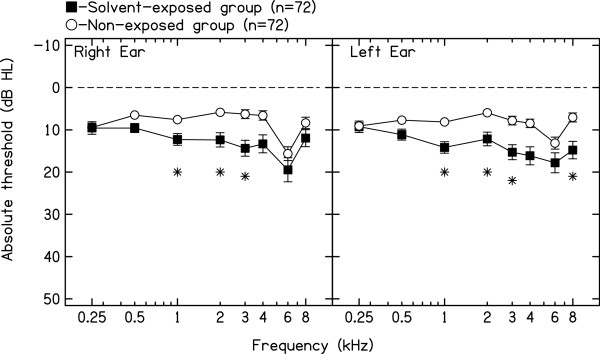
Mean right and left ear pure-tone thresholds (250–8000 Hz) and standard errors for both groups of subjects. * denotes significant differences between solvent-exposed and non-exposed control subjects at p < 0.003 (Mann–Whitney test).

Mean right and left ear pure-tone thresholds (250–8000 Hz) and standard errors for both groups of subjects. * denotes significant differences between solvent-exposed and non-exposed control subjects at p < 0.003 (Mann–Whitney test).