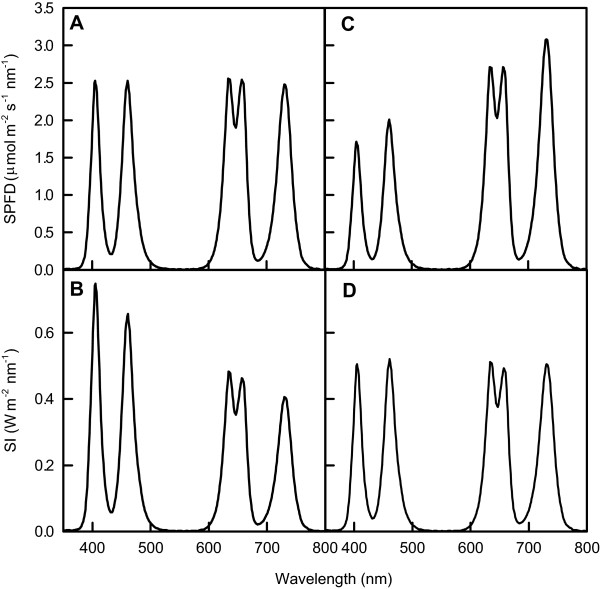
Figure 7.
Mixing ratio controlled SPFD and SI values at the five λps. The SPFD values were adjusted at 2.5 μmol m–2 s–1 nm–1 (A) with the corresponding SI curve (B). The SI values were adjusted to 0.5 W m–2 nm-1 (D) with the corresponding SPFD curve (C). The SPFD and SI values were measured at x = y = 0 and z = 17.3 cm.

