
Figure 6.
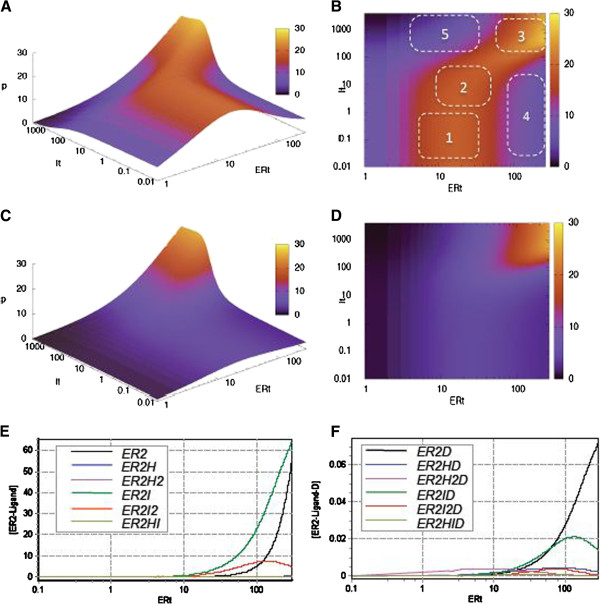
Exploration of transcriptional response to tamoxifen in the wide range of ER concentrations. 3D-graphs (A,C) and their 2D-projections (B,D), showing the dependence of the steady state protein expression p̅ on the concentration of tamoxifen and estrogen receptor. Simulations were run for 0.5 (A,B) and 0.1 nM (C,D) of 17β-estradiol. Numbers on the graph 6B correspond to the areas of high and low tamoxifen agonism, as explained in the text. (E) and (F): Concentration of different forms of receptor-ligand and transcription complexes present at ERE as a function of ER expression level. The concentration of hormone (Ht) and tamoxifen (It) were fixed at 0.5 and 100 nM respectively.