
Figure 4.
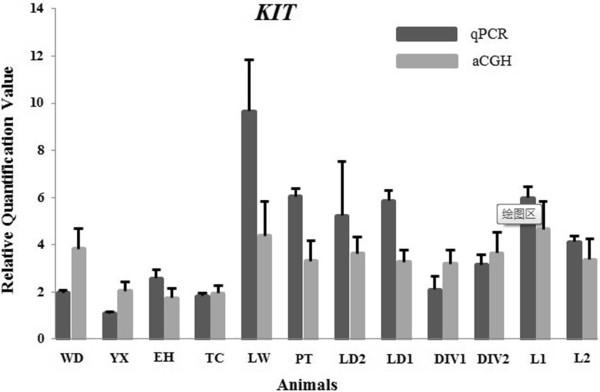
Validation of CNVR _100 (KIT gene) detected from the CGH array data using real-time quantitative PCR analysis. The x-axis represents the animals and the y-axis shows the relative quantification value (2-ΔΔCt values for qPCR; 2*(2^Sample signal) values for array CGH).