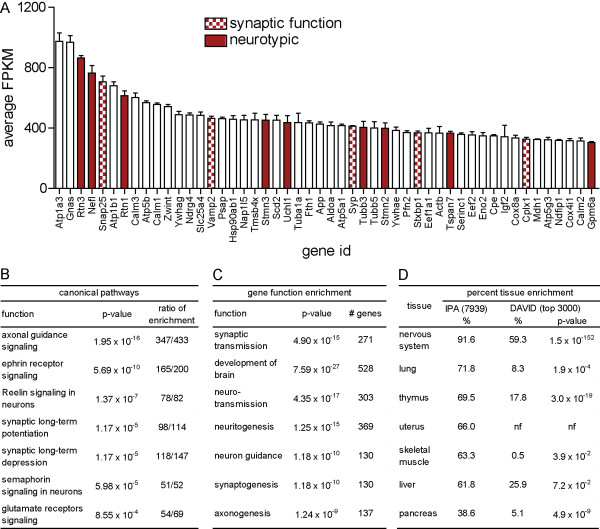
Figure 6.
Characterization of RNA-seq data. A. Quantification of the fifty most abundant transcripts expressed in DIV 14 ESNs (n = 5 cultures). Neurotypic (red) and synaptic function (checked red) genes are indicated. Error bars indicate standard deviations. B. IPA analysis of over-represented canonical pathways, indicating p-values and the number of mapped and identified transcripts identified within each pathway. C. IPA analysis of over-represented gene functions, indicating number of mapped and identified transcripts associated with each function. D. Tissue-specific gene enrichment from 7939 mapped and identified transcripts with FPKM ≫ 3.0 using Ingenuity Pathway Analysis (IPA). Right: Tissue-specific enrichment among the 3000 most abundant genes determined using DAVID [16,17]. nf, not found.

