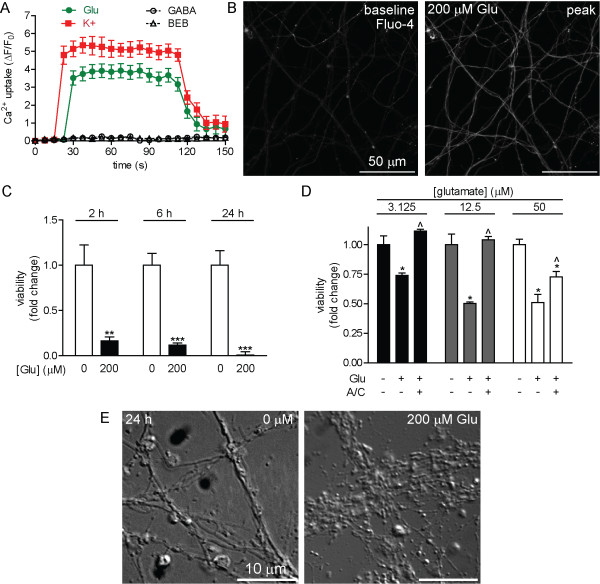
Figure 8.
ESNs exposed to glutamate exhibit acute and chronic sequelae mediated by GluRs. A. Fluo-4 measurements of Ca2+ uptake following the addition of glu (green), GABA (solid, black) or vehicle control (open, black; n ≥ 19 for all samples). K+ (red) was used as a positive control. Error bars indicate standard error. B. Representative images of Ca2+ uptake in ESNs incubated with Fluo-4 and treated with 200 μM glu. C. Glu toxicity (200 μM) in ESNs is time-dependent (n=6 for each condition). Data are expressed as fold change relative to control populations. Error bars indicate standard deviation. D. Co-administration of ionotropic GluR antagonists APV and CNQX (A/C) blocks glutamate-induced neuron death at 2 h. * indicates P < 0.05 between control and indicated condition. ^ indicates P < 0.05 between glutamate and glutamate plus A/C. (+) and (−) indicate the presence or absence of glutamate or APV/CNQX, respectively. Data are expressed as fold change relative to 0 μM glutamate. E. Neurite degeneration and varicosity formation 24 h after exposure to 200 μM glutamate.

