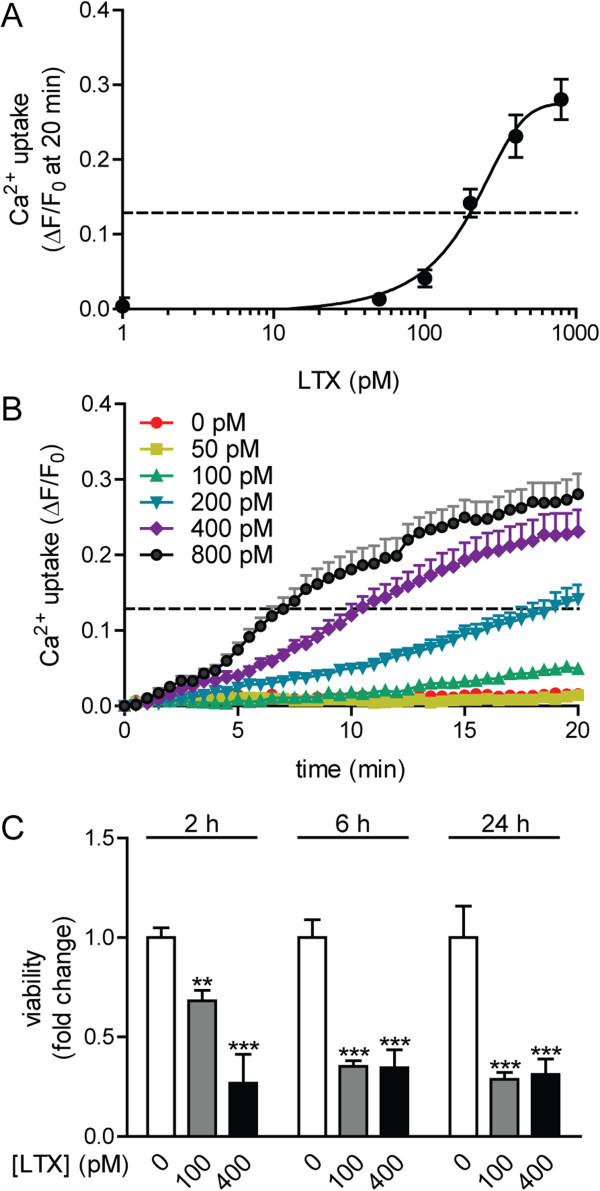
Figure 9.
LTX treatment results in acute Ca2+ influx and loss of metabolic activity. A. Intracellular Ca2+ levels correlate to LTX dose at 20 min after exposure (n = 8). B. Longitudinal characterization of Ca2+ uptake over a 20 min period after LTX addition (n = 8). A, B. Dotted line indicates the EC50 (representing the dose of LTX that resulted in 50% of the maximum fluorescence) of 174.9 pM. Error bars indicate the standard error. C. Dose-dependent reduction in ESN viability 30 min after LTX addition (n = 8). The data are expressed as fold-change relative to 0 μM glutamate. Error bars indicate standard deviations.

