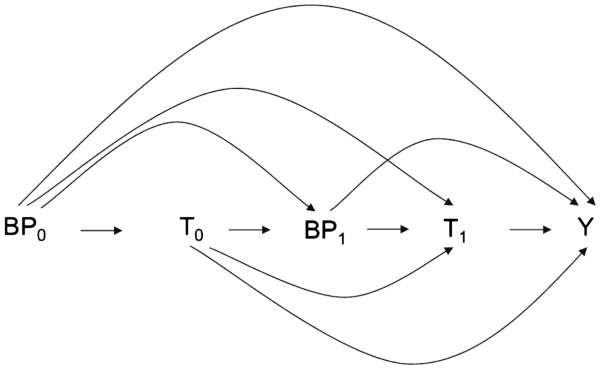
Figure 1.

Directed acyclic graph illustrating time-dependent confounding by blood pressure in the treatment of hypertension. Abbreviations: →, causal effect; BP0, blood pressure at time 0; BP1, blood pressure at time 1; T0, antihypertensive treatment at time 0; T1, antihypertensive treatment at time 1; Y, cardiovascular event.
