
Figure 1.
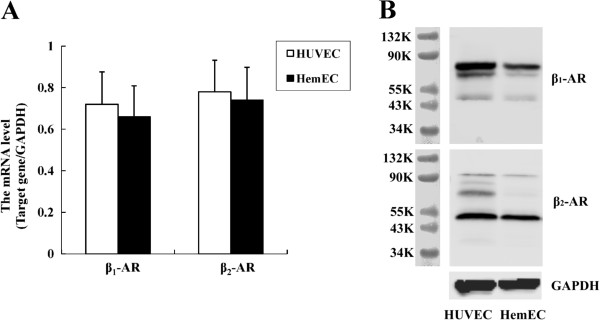
Expression of β-ARs in HemECs. A, Real-time PCR expression assays measure the β1- and β2-AR expression in HemECs. The data are represented as the relative abundance of each target gene normalized to the GAPDH levels. B, Western blot analysis of β1- and β2-AR expression in HemECs. Cell lysates probed for β1-AR revealed two bands with an apparent molecular weight of 65-75 kDa, and one band at 51 kDa. Two bands were observed when HemEC lysates were probed for β2-AR: one band with molecular weights of 47 kDa, another band at 90 kDa. These bands were not observed in blots incubated with normal rabbit serum (not shown).