Figure 1.

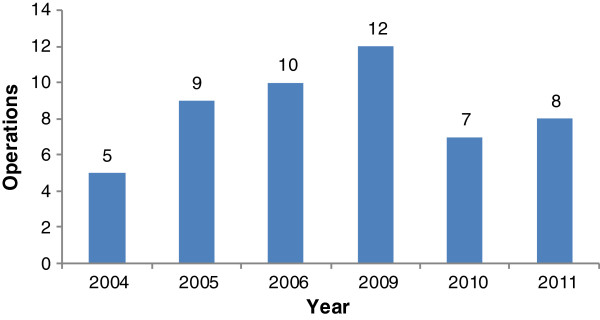
Annual distribution of OHS procedures. This graph shows the annual distribution of OHS cases between 2004 and 2011. There was no activity for 2007 and 2008.

Annual distribution of OHS procedures. This graph shows the annual distribution of OHS cases between 2004 and 2011. There was no activity for 2007 and 2008.