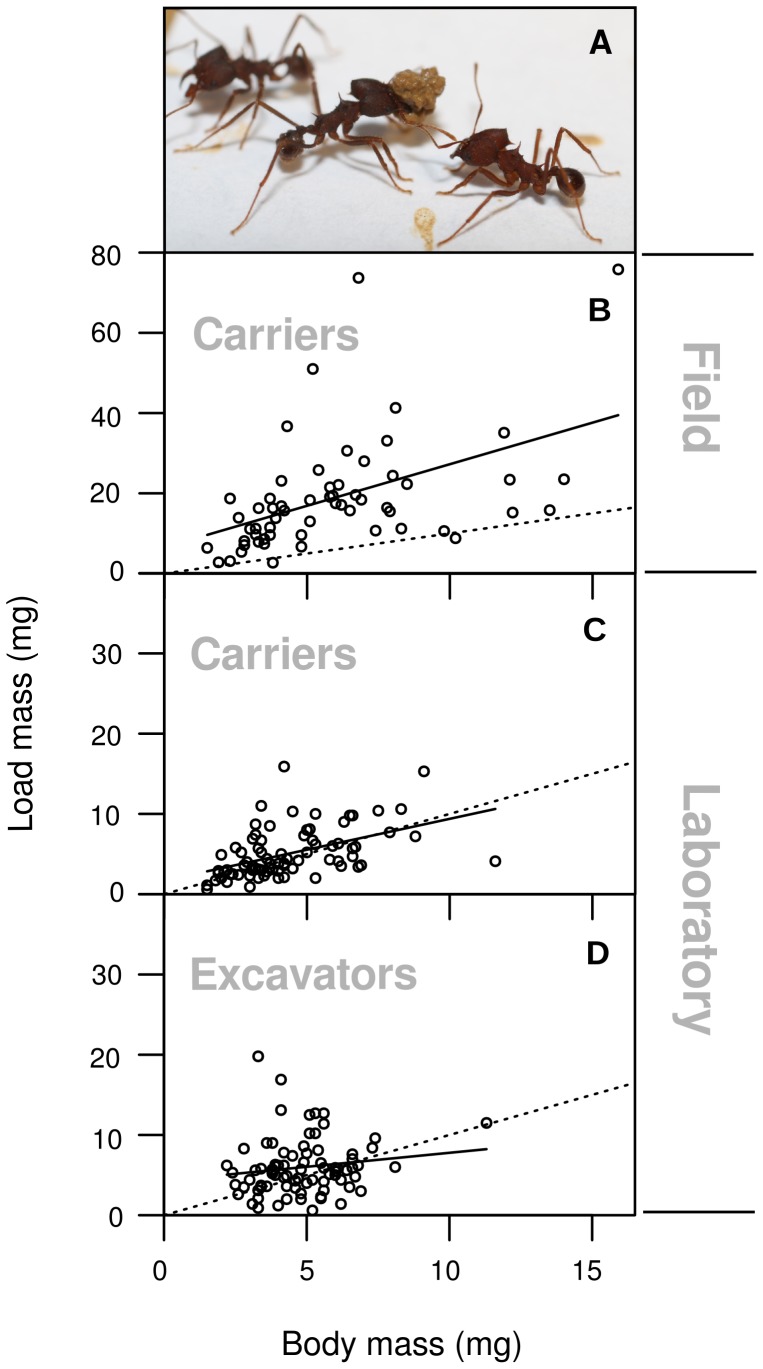
Figure 2. Relationship between pellet mass (mP) and worker body mass (mW).
In each graph, the solid line represents the regression line and the dotted line a hypothetical 1∶1 ratio of load mass to carrier mass. Data points above that line correspond to carriers less heavy than their loads. (A) A. vollenweideri worker carrying a soil pellet in the laboratory (Photo: Andrew I. Bruce). (B) Pellets and carriers collected at the openings of field nests ( mP = 2.1 mW+6.5, r 2 = 0.22, N = 60, P<0.001). (C) Pellets and carriers collected from laboratory colonies at 2 m distance from the excavation site ( mP = 0.8 mW+1.7, r 2 = 0.24, N = 80, P<0.001). (d) Pellets and excavators collected directly at the excavation site ( mP = 0.3· mW+4.3, r 2 = 0.02, N = 80, P = 0.1859).

