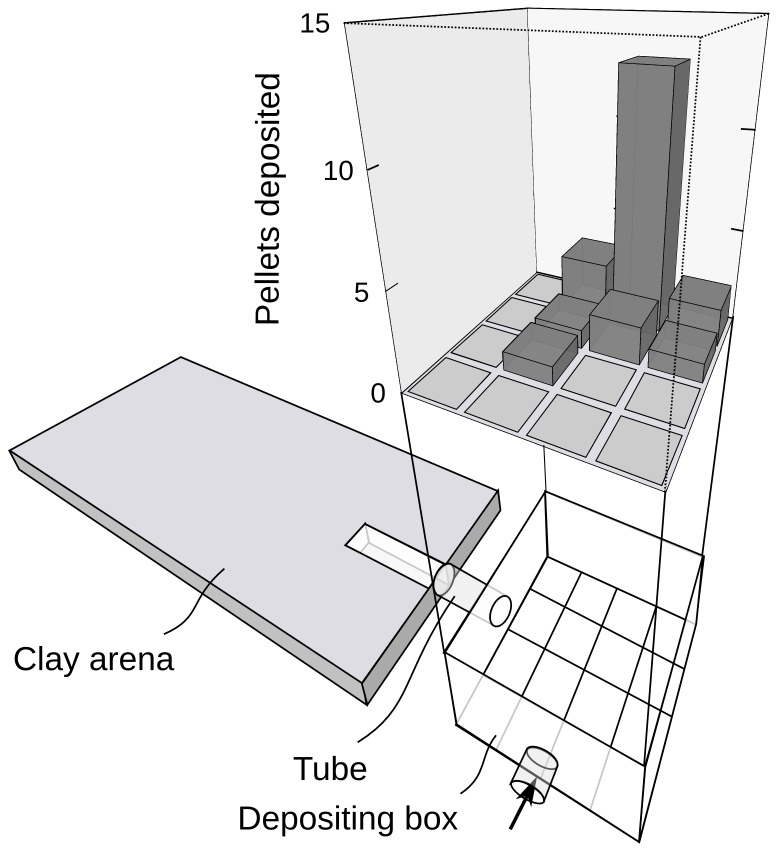
Figure 5. Example of the distribution of pellets deposited by a single worker in the depositing box.
Shown are the clay arena, where individually marked workers excavated soil pellets, and the depositing box, where most pellets were dropped by the observed individuals. The thick arrow indicates the location where the animals entered the set-up. To reconstruct the individual pattern of pellet deposition for each observed worker, the ground of the depositing box was divided into 16 equal squares. The number of pellets dropped in each square by one individual was counted. Each bar in the graph represents one of the possible 16 areas distinguished inside the box, with the height of the bar indicating the number of pellets dropped inside this field by the observed individual. The worker observed for this example (worker nr. 7) placed 23 pellets in the box within a period of 44 min. The resulting index of dispersion was 7.2. The three-dimensional barplot is based on a script by Michal J. Figurski (http://addictedtor.free.fr/graphiques/graphcode.php?graph=161).

