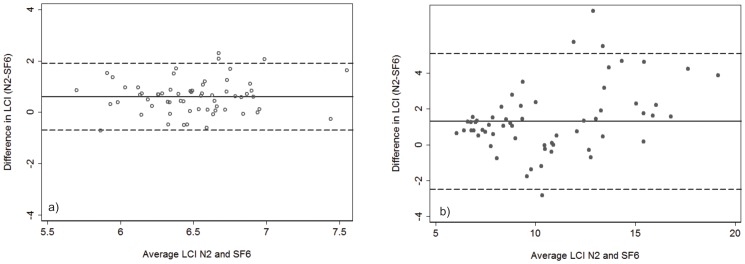
Figure 2. Bland Altman Plot of the agreement between LCI N2 and LCISF6 in a) healthy controls and b) subjects with Cystic Fibrosis.

The solid horizontal line represents the mean difference, and the dashed lines represent the limits of agreement (mean difference+/−2SD). In health, there was good agreement between the systems, the mean difference (LCIN2−LCISF6 was 0.61 (95% CI 0.45 to 0.78), limits of agreement (−0.7 to 1.9)); whereas in CF there was an obvious bias (mean difference = 1.41 (95% CI 0.92 to 1.90), limits of agreement (−2.4 to 5.2)) such that LCIN2 increased disproportionately to LCISF6 as mean LCI increased.
