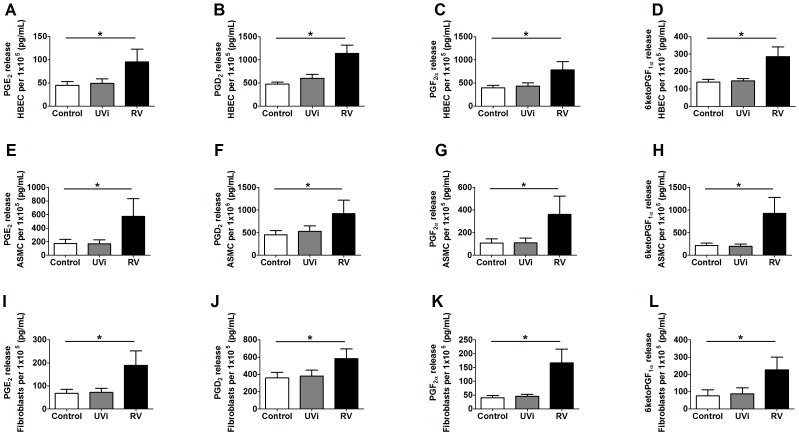
Figure 3. RV infected primary HBECs, ASMCs and lung fibroblasts induced prostaglandins.
HBECs (n = 5) (A–D), ASMCs (n = 12) (E–H) and lung fibroblasts (n = 4) (I–L) were uninfected (Control) or exposed to: UV inactivated RV (UVi-RV) or replication competent RV (RV) at an MOI = 1 for 24 hours. Levels of PGE2 (A, E, I), PGF2α (B, F, J), PGD2 (C, G, K) and the PGI2 metabolite 6ketoPGF1α (D, H, L) in the supernatant were measured using ELISA and normalised to total cell number calculated using manual cell counting with trypan blue exclusion after 24 hours. Data represent mean ± SEM. Statistical differences were detected using 1-way ANOVA with Bonferroni post test comparisons to prostaglandin levels in the presence of control conditioned medium *p<0.05.

