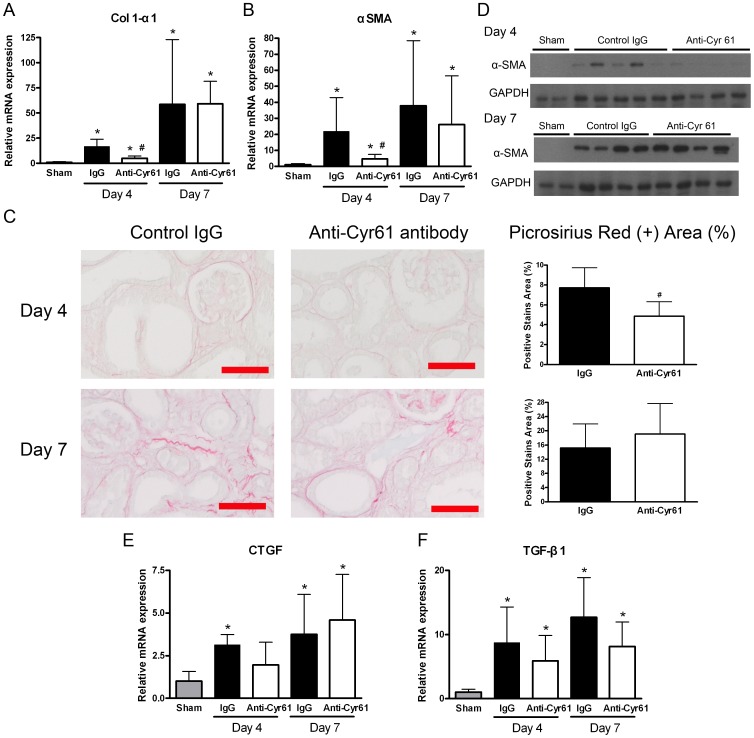
Figure 7. Effect of Cyr61 blockade on renal fibrosis in UUO kidneys.
The mice received an intraperitoneal injection of 10 µg/g BW of the control rabbit IgG (filled bar) or anti-Cyr61 antibody (open bar) 2 hours before the UUO surgery and then one dose per day until euthanasia. (A–B) Q-PCR showing renal Col 1-α1 (A) and α-smooth muscle actin (α-SMA) (B) transcripts after UUO. N = 8/group. (C) Representative images of picrosirius red staining for interstitial fibrillar collagen (red) in the UUO kidneys (magnification 200×, scale bar = 100 µm). The bar charts are a summary of the picrosirius red-stained percentage in the field. N = 8/group. (D) Representative images of Western blots of renal α-SMA protein expression in the UUO kidneys. (E–F) Q-PCR showing no difference in renal CTGF (E) and TGF-β1 (F) transcripts between the 2 groups. N = 8/group. All of the Q-PCR data are expressed as the fold differences compared to the sham operation kidneys (gray bar). The values are the mean+SD. *P<0.05 vs. sham operation; #P<0.05 vs. control IgG.

