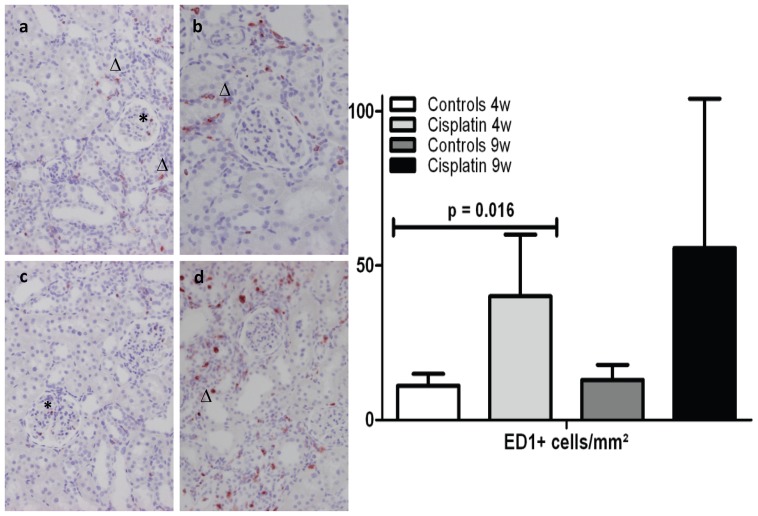
Figure 2. Interstitial and glomerular ED1 infiltration.
Left part: ED1 positive cell in a glomerulus (*) and in the interstitium (▵) of a) a control rat at 4 weeks; b) a cisplatin-treated rat at 4 weeks; c) a control rat at 9 weeks and d) a cisplatin-treated rat at 9 weeks. Right part: Effect of cisplatin on the infiltration of ED1-positive cells. Results are expressed as the mean ± SD of the absolute numbers of immunoreactive cells per mm2, each group containing n = 6. Statistics were performed using generalized linear models.

