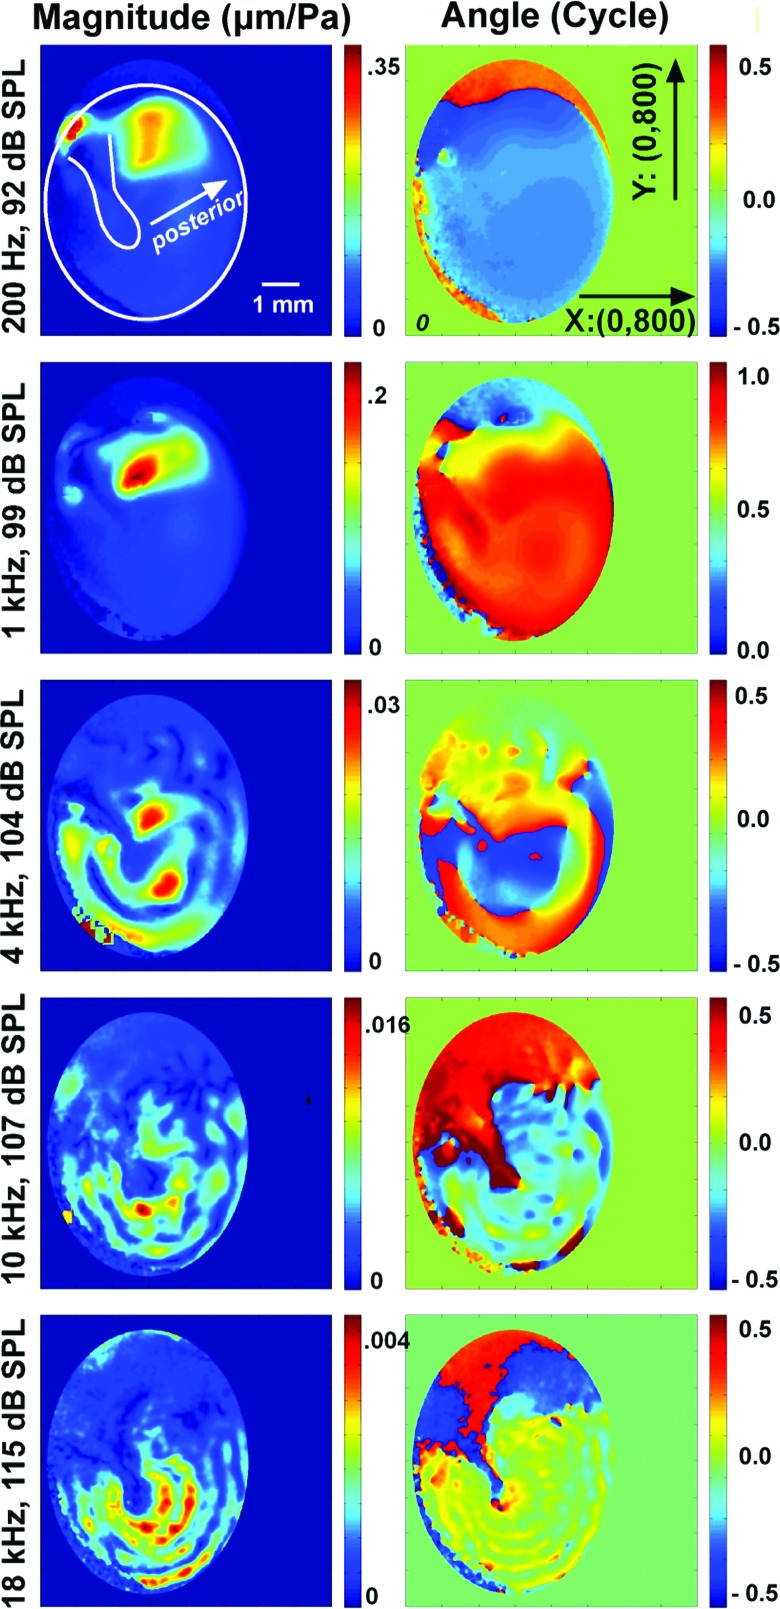
Figure 1.
TM surface displacements measured by stroboscopic holography on TB 09_I normalized by pressure. The displacement magnitude |D| normalized by the stimulus sound pressure (units of μm/Pa; left column) and phase angle in cycles (right column) are coded with different colors as shown in the color bar on the right side of each plot. The stimulus frequencies from top to bottom are 0.2, 1, 4, 10, and 18 kHz, with an appropriate stimulus level given at each frequency to produce measurable TM displacement. The shapes of the TM and the manubrium are outlined in the magnitude plot at 200 Hz (top left), with arrows pointing to the posterior side of the TM. The size of each image is 800 × 800 pixels along the X-Y axes, as shown in the phase angle plot at 200 Hz (top right). An ellipse-shaped mask has been applied to exclude non-TM regions in data analysis.

