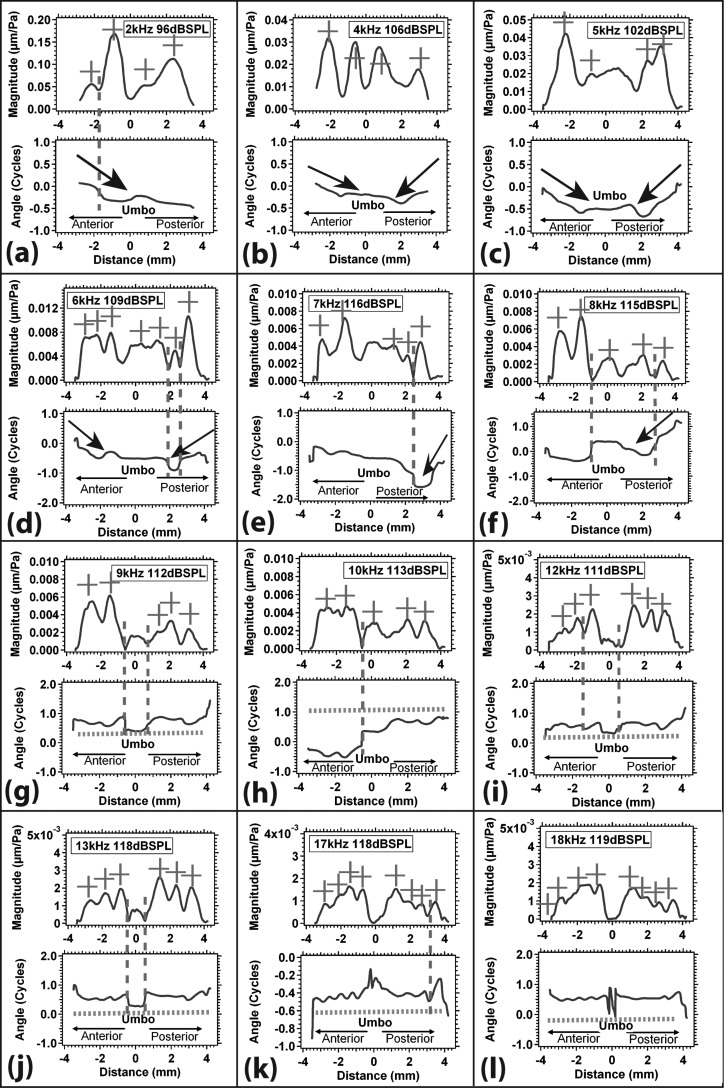
Figure 10.
(Color online) The normalized displacement magnitude and phase angle of the TM along two similar radial lines [as in Fig. 11a] for TB 10_5 between 2 and 18 kHz (a)–(l). Again, the x-axis represents the distance along two radial lines from the umbo (where x = 0), and the y-axis represents normalized displacement magnitude and phase angle. The red + sign marks local displacement magnitude maxima, the red vertical dashed line marks modal node, the black arrow suggests traveling wave, and the green dashed line marks phase ripples.

