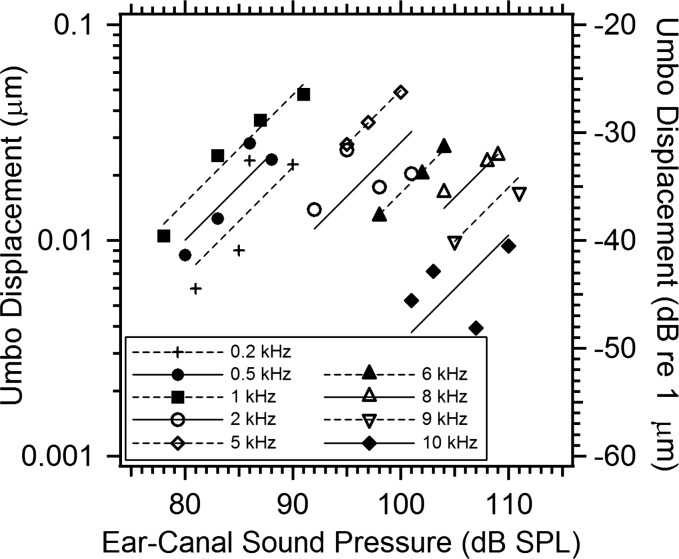
Figure 3.
Growth of the umbo displacement with stimulus level in TB09_II. The umbo displacement magnitudes in micrometers (left axis label) or dB per micrometer (right axis label) are estimated from the complex average displacement in a 10 × 10 pixel array centered on the umbo location, at 9 stimulus frequencies from 0.2 to 10 kHz and 2 to 4 stimulus levels at each frequency. The measured magnitudes at each frequency are plotted vs stimulus level in dB SPL as individual symbols. The figure also includes unit-slope line segments fit through the mean dB displacement and dB level of the stimulus at each frequency.

