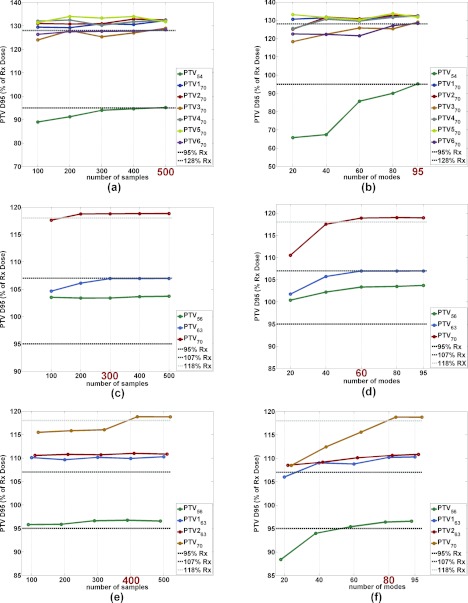
Figure 2.
(a), (c), and (e) PTV D95 for all contoured PTVs at different prescription levels as the number of samples is increased for three H&N patients. (b), (d), and (f) PTV D95 for all contoured PTVs at different prescription levels as the number of modes is increased for three H&N patients. The highlighted number on the x-axis indicates the number of samples and modes that were sufficient to achieve satisfactory PTV coverage for all PTVs in the given patient. Plots (a) and (b) correspond to a nasopharynx case, plots (c) and (d) correspond to an oropharynx case, and plots (e) and (f) correspond to a larynx case.

