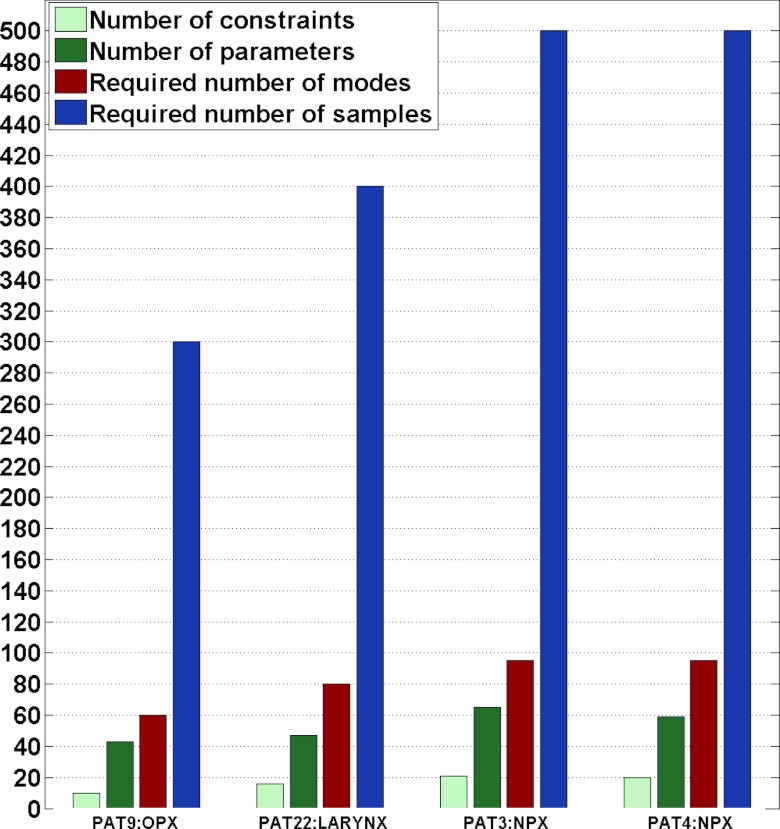
Figure 3.
The number of samples and modes required for four H&N patients in order to achieve target coverage. For each patient, the left two bars indicate the number of constraints used in the constrained optimization and the number of parameters used in the unconstrained optimization, respectively; a lower number of parameters corresponds to fewer required modes (third bar) and samples (fourth bar) to achieve coverage.

