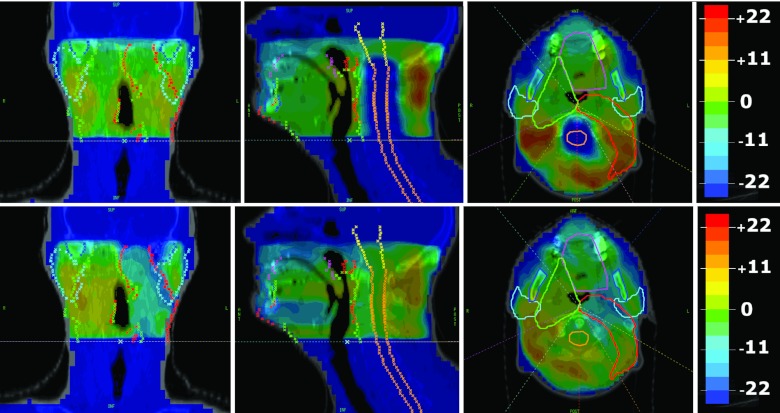
Figure 4.
(Top) Dose distributions corresponding to the first mode for one patient. (Bottom) Dose distributions corresponding to the second mode for the same patient. In this case, the first mode spares the cord while delivering similar doses to the PTVs, and the second mode concentrates dose to PTV59, while sacrificing dose to PTV66 and sparing the left parotid. Warmer colors represent positive doses and cooler colors represent negative doses. The contoured structures include the brainstem (yellow), cord (orange), oral cavity (pink), parotid glands (cyan), mandible (blue), PTV59 (green), and PTV66 (red).

