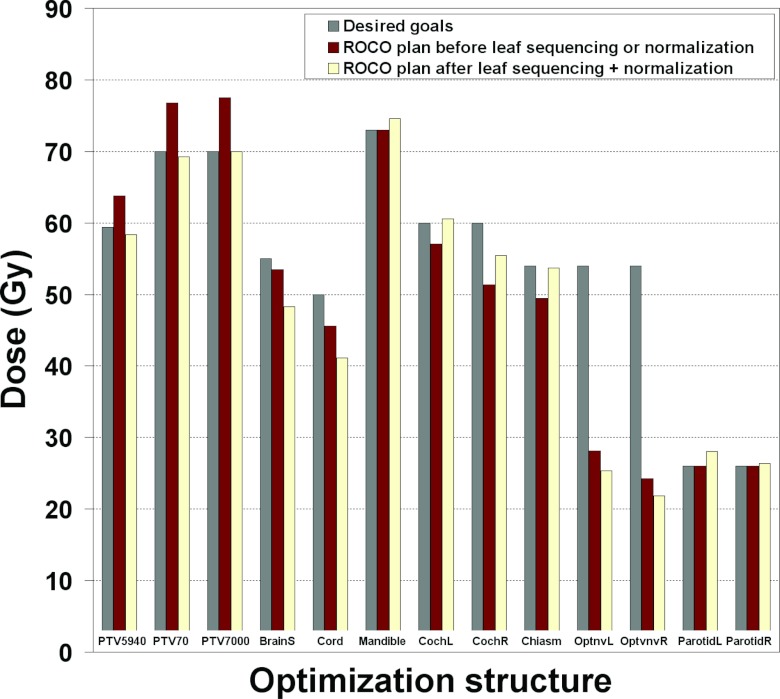
Figure 8.
Comparison of the requested planner constraints (left bars), the resulting ROCO plan prior to leaf sequencing or normalization (middle bars), and the ROCO plan after leaf sequencing and normalization (right bars) for the live session. The ROCO plan meets all the constraints prior to leaf sequencing or normalization, and meets most constraints after the D95 value for the PTV7000 structure of the ROCO plan is scaled to equal the planner constraint. For several structures the ROCO plan does much better than requested (e.g., Dmax for the cord and brainstem).

