Figure 9.

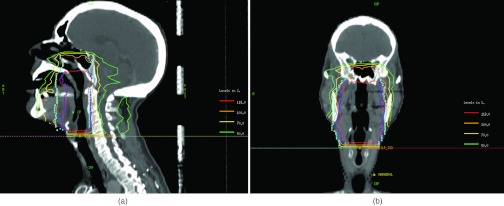
(a) Sagittal and (b) coronal slices of the ROCO plan from the live session. The 100% and 118% isodose levels show that the ROCO plan conforms well to the two levels of prescription specified in cyan (PTV5940) and blue (PTV70) respectively.

(a) Sagittal and (b) coronal slices of the ROCO plan from the live session. The 100% and 118% isodose levels show that the ROCO plan conforms well to the two levels of prescription specified in cyan (PTV5940) and blue (PTV70) respectively.