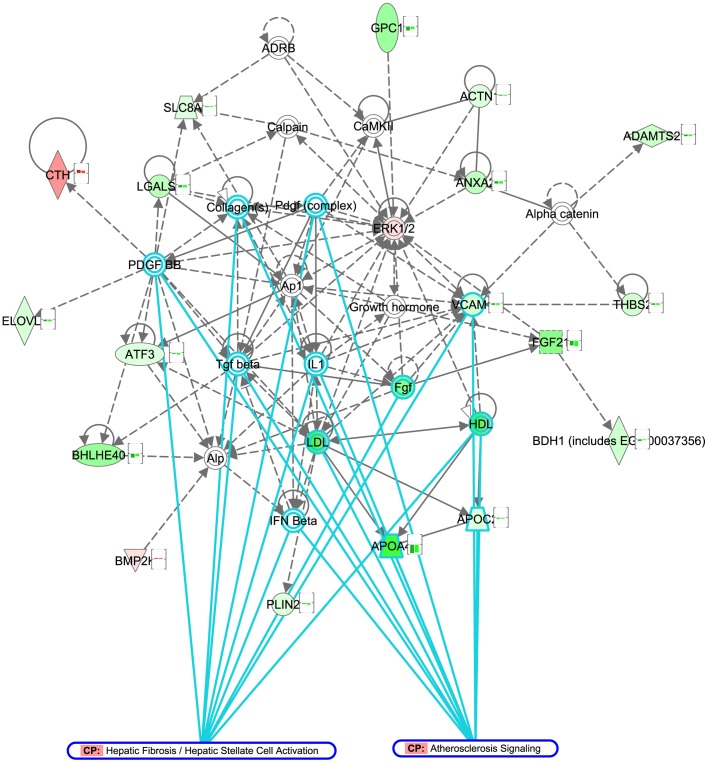
Figure 4. Molecular network of genes related to atherosclerosis signaling and hepatic fibrosis signaling pathway.
Genes differentially expressed in dietary lifestyle intervention (DLI), compared to HFD were subjected to network analysis (Ingenuity Pathway Analysis). The network of genes associated with processes “Cellular Growth and Proliferation”, “Connective Tissue Development and Function” and “Hepatic System Development and Function” (network score 32) is represented in the figure. Genes or gene products are represented as nodes, and the biological relationships between two nodes are represented as edges (lines). The nodes of the network are colored according to log2 gene expression changes in the DLI vs. HFD comparison (red: upregulation, green: downregulation). The bar graph associated with each node represents log2 expression changes in chow (1st bar) and DLI groups (2nd bar) vs. HFD group, highlighting that all represented genes change in equivalent direction in chow and DLI conditions. The function “Overlay: Canonical Pathway” was used to highlight network genes associated with “atherosclerosis signaling” (11 genes, top enriched pathway) and “hepatic fibrosis/hepatic stellate cell activation” (9 genes, 3rd enriched pathway). All genes associated with these pathways, as well as majority of genes in the network are downregulated in DLI group, indicating withdrawal of pathogenic signals upon dietary lifestyle intervention.

