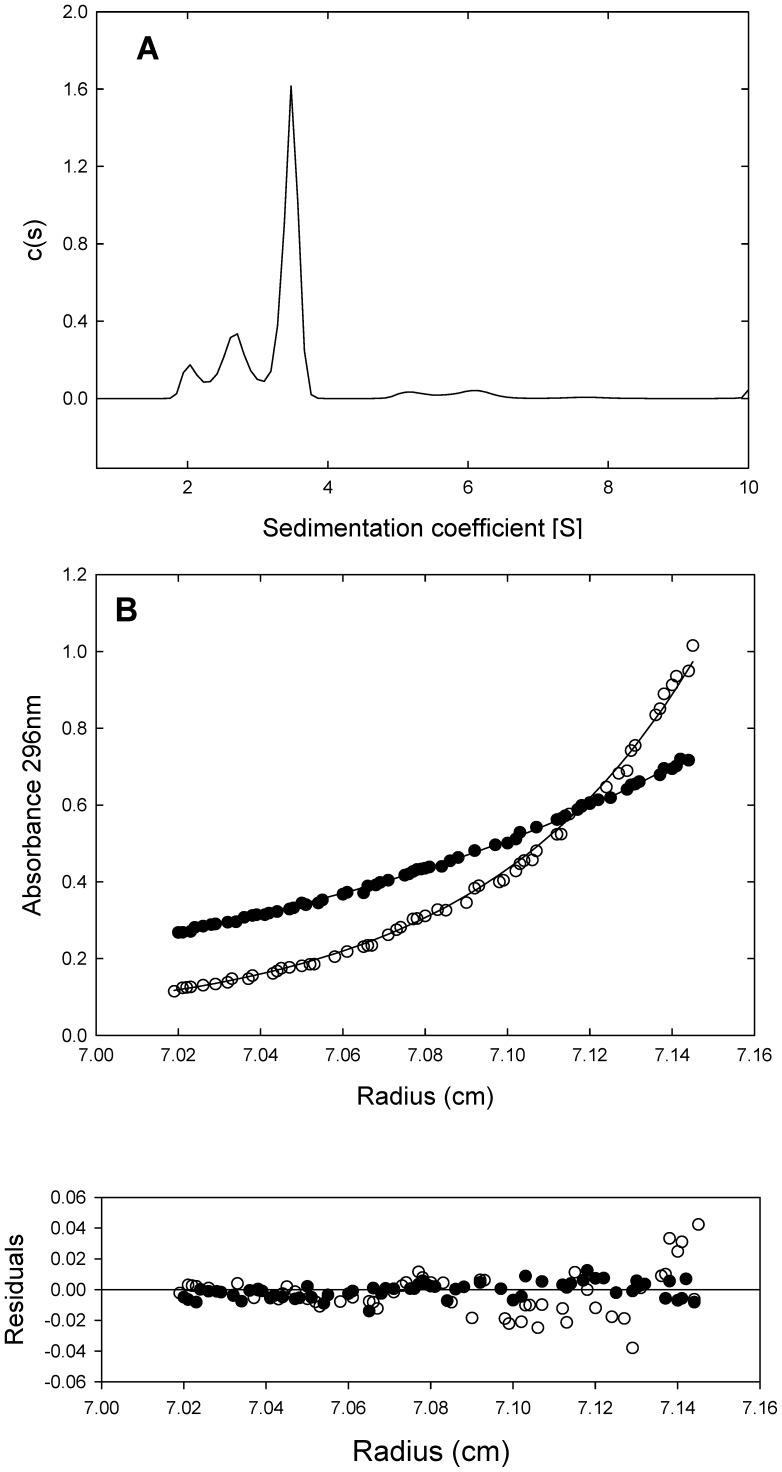
Figure 3. Analytical centrifugation experiments.
(A) Sedimentation coefficient distributions c(s) corresponding to the sedimentation velocity of PhaF. (B) Sedimentation equilibrium analysis of the association state of PhaF. Sedimentation equilibrium absorbance gradients were carried out at 10,000 r.p.m. (open circles) and 16,000 r.p.m. (closed circles). The solid lines show the corresponding best-fit gradients for a single sedimenting species at equilibrium with a solution average molar mass of 85000 Da. The residuals (difference between the experimental data and the fitted data for each point) are shown at the bottom of this panel.

