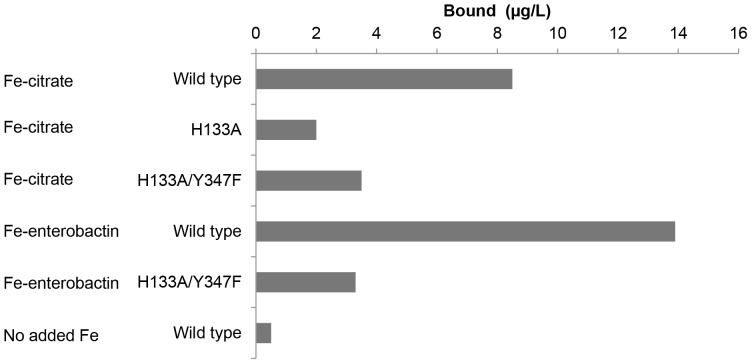
Figure 3. Elemental analysis of SEC peaks by ICP-MS.
Values given are means of triplicates and relate to measured iron content by ICP-MS in the SEC fraction collected at 11–13 ml, corresponding to the elution position of the FrpB monomer. 33 µM FrpB F3-3 was mixed with either 990 µM Fe-citrate or 330 µM Fe-enterobactin, before separation by SEC.

