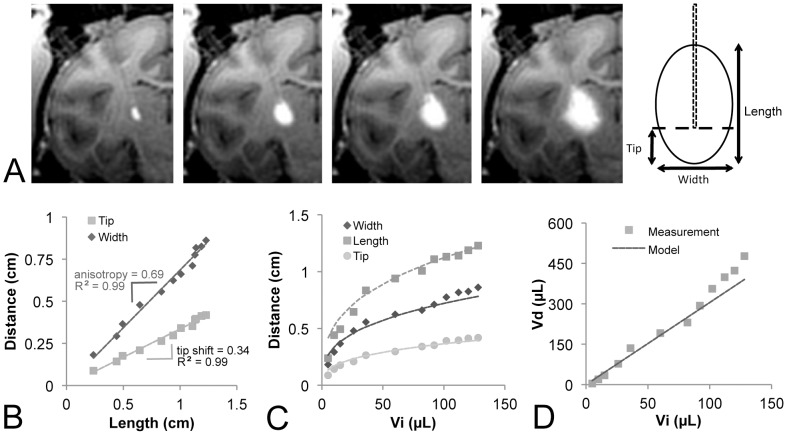
Figure 1. Development of the infusion model.
(A) The length, width and cannula tip location were measured at each timepoint during the infusion (Vi 10 µL, 50 µL, 80 µL, 120 µL). (B) The width and tip distances scaled linearly with the infusion length. (C) The distance measures scaled as cubic roots (solid lines) of the infusion volume. (D) The resulting spheroid simulation showed good agreement with the measured volumes.

